
Q1 2023: Superforecasting
Q: Allen, why title this WMQ “Superforecasters?”
At the beginning of the year, investor demand for market and economic forecasts tends to be high. Consequently, investment firms readily create a supply of forecasts to meet the demand. These market forecasts, however, are rarely subjected to later scrutiny. This is unfortunate because most financial forecasts are not very good. Philip Telock and Dan Gerdner, two experts on the topic of forecasting, have repeatedly found that “the average forecast is about as accurate as a chimpanzee.”
Efficient market theorists Dr. Burton Malkiel made this same argument in his 1973 book, A Random Walk Down Wall Street, when he suggested that “since all available information is quickly factored into stock prices, all stocks present equal chances for gains. The theory taken to its extreme means that a blindfolded monkey throwing darts at a newspaper’s financial pages could select a portfolio that would do just as well as one carefully selected by the experts.”
The Wall Street Journal famously turned Dr. Malkiel’s statement into a regular feature for 14 years with a dart throwing contest. The contest would track analyst stock picks against a portfolio of stocks selected by means of random darts thrown at the stock pages of the Journal. Dr. Malkiel, in fact, threw the first dart. Over the 14 years of the contest, the pros actually did beat the darts, but the efficient market theorist argued that it was not a fair contest given that only four stocks, rather than a large number of stocks, were being selected each time. For readers interested in learning more about the history of the contest, here is a link.
http://www.investorhome.com/darts.htm
Since we all make forecasts regarding our lives, and our investment and financial planning teams make forecasts and projections, I am quite certain that our clients would prefer that we become well-trained and skilled monkeys, rather than remain average chimpanzees. As a result, I thought in this WMQ we should explore what “Superforecasting” involves and how we might all become “Superforecasters.” I also wanted to share with clients how our strategic financial planning and investment processes are designed to improve projections and provide more clarity regarding potential future outcomes to help them in their decision making.
LISTEN TO THE PODCAST
Allen Gillespie, CFA®, Managing Partner Investments
Mercer Treadwell, CFA®, Senior Vice President, Investment Advisor
David Lewis CFA®, Chief Financial Officer
Thomas Sheridan, Financial Analyst
Holland Church, Data Analyst
EXECUTIVE SUMMARY
- Monetary Policy: Tightening. The Federal Reserve has been raising interest rates, and it intends to shrink its balance sheet.
- Fiscal Policy: Tightening. The CBO projects federal spending to flatline in 2023.
- Economic Vital Signs: Inflationary pressures while high, are starting to show signs of moderation.
- Yield Curve Watch: The yield curve is beginning to invert, which historically has preceded recessions by about 18 months.
Q: What is a “Superforecaster?”
In the book Superforecasting: The Art and Science of Prediction Philip Tetlock and Dan Gerdner examine and explore what we can learn from people who have been proven statistically to be “Superforecasters.” Superforecasters are those who consistently rank in the top 1 to 2% of forecasting accuracy. Interestingly, superforecasters’ skills stretch beyond even their fields of direct expertise. Superforecasters appear to have risen above chimpanzee levels of foresight.
Q: Are Superforecasters just smarter than the rest of us?
No, not at all. The professors have spent decades examining individuals across a wide variety of factors like intelligence, training, personalities, etc. and they have concluded that good forecasting is “a skill which can be cultivated.” There are certain personality traits and analytical methods, however, which are critical to a good forecasting process. In addition, there are certain conditions under which forecasting accuracy will be better or worse. In its own study on the topic, the Harvard Business Review reports that forecasting accuracy can be improved by 14% with just an hour of staff training on statistical concepts and cognitive biases.
Q: What are the key personality traits associated with good forecasting?
For anyone who has accomplish most anything, in any field, it won’t be a surprise, but the researchers found that “a commitment to self-improvement is the strongest predictor of performance.” Beyond that, the professors have found that superforercasters are open- minded, careful, curious, focused, and above all, self-critical.
Superforecasters tend to be very numbers oriented people – they find ways to quantify information. They are also news junkies, which means they are open minded when it comes to examining new information. Superforecasters regularly update their projections, which requires enough humility to admit errors, and they recognize when things are going off course. They correct their forecasts through a process of gradual correction based on new information, not large emotionally based changes. Bruce Yandle, a friend and the retired former head of Clemson’s economics department, says that he was a good forecaster because he forecasted often—turns out there was a lot of truth in his joke.
Q: What are the conditions necessary for a good forecast?
The professors did find that there are certain conditions under which good forecasts are more likely to be made, and certain conditions under which forecasting becomes much more difficult. In statistical language, there are times when the confidence interval is narrow and there are times when the confidence interval is wide. A clear forecasting horizon is one key variable required for making more accurate forecast.
In financial planning and economic forecasting, I personally believe a clear forecasting horizon may be one of the most important variables because every asset class has a cycle. There are times when returns are negative, which leads to drawdowns, and times when performance is good. We all know that, and yet, I have never heard a client or been in an investment meeting where someone says, we should buy this stock, manager, fund, etc. because the recent returns have been horrible.
When FinTrust’s investment team builds models or selects investments, we talk about the big risk questions associated with these cycles: how bad can it get? how fast can it get that bad? how long will any recovery take? and, where do we think we are relative to the cycle? While these are important portfolio questions, what really determines a client’s success is do they have that amount of time and the emotional confidence to invest through the cycle. In my personal experiences with clients over 28 years, I have
“In my personal experience with clients over 28 years, I have seen that clients that invest through the cycle tend to do better than those that try to time the cycle.”
seen that clients that invest through the cycle tend to do better than those that try to time the cycle. Full cycle investors intuitively understand that valuations matter, so they tend to avoid performance chasing and panic selling. Bill Kibler in our Anderson office sums this up nicely by saying, “it’s time in the market not timing the market that matters.”
Q: Can you expand on this for clients?
Using data from Dow Jones, on a random day, the stock market has roughly a 53% chance of being up. If one extends the time horizon to a year, the chances of the stock market being up rise to the 67-70% level, and if you extend the horizon further out to 10 years, your chances of a positive outcome increase yet further.
Historically, the equity markets return 4-6% more than the short-term cash interest rates. This created a problem for people when the Federal Reserve took interest rates to zero, and the 10-year bond hit 0.60% in 2020. No one wants to earn 0% on their money, but equities have risks. The example I like to share with clients is this—let’s pretend I put my money in the market and expect to earn 6% a year, but the 1987 stock market crash happens the next day and stocks decline 40%. Well, in 7 years you would still have more money than you started with, so it would be better than the 0% your cash is earning. In fact, 10-years after both the 1987 decline and the 2008 declines, investors who bought the peaks would still have more than doubled their money if they stayed the course.
Accurately understanding statistics then changes the client conversation. The correct questions then are not what will the stock market do, but rather questions like, do you have at least 7 or more years for your money to be invested in the equity markets, or how much do you need to have invested in the stock market, or what is a reasonable planning horizon based on life expectancy adjusted for health.
Q: What are some of the other factors that impact forecasting accuracy?
Obviously, the more quantifiable the question and data are, the more likely a good forecast can be made. Even on soft data questions, superforecasters are willing to look for data clues that others may miss.
Let me give you a funny example of this—I recently read an article about Billy Joel’s four marriages. It prompted me to look up these statistics: 41% of first marriages end in divorce, 60% of second marriages end in divorce, 73% of third marriages end in divorce, and a whopping 93% of fourth marriages end in divorce. Billy Joel is truly a case of blind hope over experience, and love over logic. What made the story ironic is that one of his very first big hits was a 1977 song titled “Movin’ Out.” At a subconscious level, I guess he knew what he would be doing in the future, and the ex-wives were fairly warned.
Additional factors that can impact forecasting accuracy are cognitive biases and incentives. Wall Street has its own unique cognitive biases and incentive structures, so it makes some routine forecasting errors.
Q: Can you give us some examples of these Wall Street biases?
In a 1998 research paper, Vijay Chopra at Banker’s Trust found that investment analysts tend to overestimate future earnings by a whopping 41%. As a result, there is a well-known tendency for sell-side earnings estimates to decline throughout the year. The poor forecasting abilities of analysts might surprise some people, but when one considers incentives, the bias becomes easier to understand. Analysts are expected to pull information out of company management teams, and management teams do not like to talk to people who might be negative on their business. As a result, the sell-side analysts make overly rosy forecast, but all their buyside client know this, so they make their own earnings forecasts. CNBC will then squawk out that XYZ company missed earnings estimates—well, who’s estimates was it?
We account for the overly optimistic Wall Street bias by using much more conservative return assumptions in our financial planning software than the default setting. We want things to work out better than expected for our clients, particularly when they are thinking about the big picture retirement questions.
Q: What does FinTrust’s do to improve its client’s forecasts?
First, we spend a lot of time asking questions to help frame the client’s time horizon. We use conservative return assumptions and stress test those assumptions. We think a lot about risk control in advance, so we build well diversified portfolios to weather bad markets. We solve for three market environments, up markets, sideways markets, and down markets. We rebalance client portfolios to take advantage of market volatility over time. An important and unique aspect of our rebalancing behavior, however, is that we handle and think about inter-asset class rebalancing differently from intra-asset class rebalancing.
Q: Can you expand on this important aspect of FinTrust’s investment process?
Over long periods of time, equities have historically had higher rates of return than bonds, so if one consistently rebalances, one will generally be selling high returning assets to buy lower returning assets. Now, you have to do that from time to time for risk control reasons, but statistically, it hurts returns. As a result, we try to only rebalance between stocks and bonds infrequently or when there are really large moves. Meanwhile, we tend to be more active in our intra-asset class rebalancing. For example, when interest rates were really low in 2020, we replaced much of our bond market exposure with market neutral equity strategies, but now that rates have returned to historical levels we have reversed that and made our bond portfolios much more aligned with the bond market benchmarks.
Any final thoughts?
Forecasting is a hard business, but I truly believe our clients can have confidence and conviction that our professionals, processes, and procedures are aligned with the best practices and core principles associated with “Superforecasting.”
Sincerely,
Allen R. Gillespie
QUICK TAKE
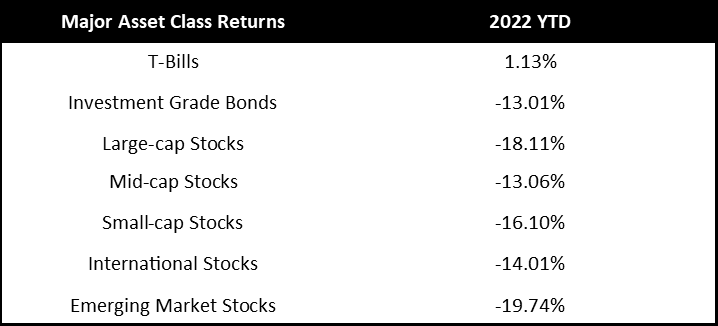
MAJOR ASSET CLASSES
Cash and Cash Equivalents
The Federal Reserve continues its push toward a 5% short term terminal rate. Short-term interest rates now exceed long-term realized inflation measures and the rates offered on longer-term bonds. As a result, we now believe short-term bonds can be utilized by both conservative and aggressive investors, as we believe the Federal Reserve is at risk of overshooting interest rates.
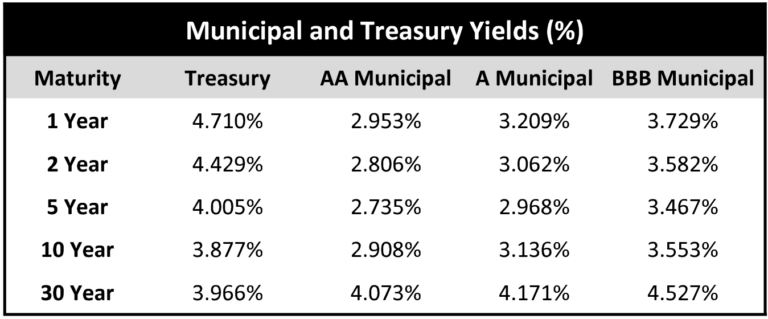
Investment Grade Fixed Income
The yield curve has begun to invert past the 1-year mark. Investment grade fixed income markets reflect a slowing economic recovery, so we would expect credit spreads to gradually begin to widen. The 10-year treasury yield is once again above the 10-year realized inflation rate, but inflation readings have been coming in hot. We believe these inflation readings peaked in the second quarter and that investment grade corporate bonds now offer reasonable yields for the environment.
Tactical Fixed Income
We recently moved our tactical fixed income allocations to be more in-line with bond benchmarks as interest rates have risen. At the margin, we believe the inflation rate has peaked, and will ultimately settle in the 3% ranges. As a result, we have rebalanced tactical fixed income positions back toward more tradition fixed income assets.
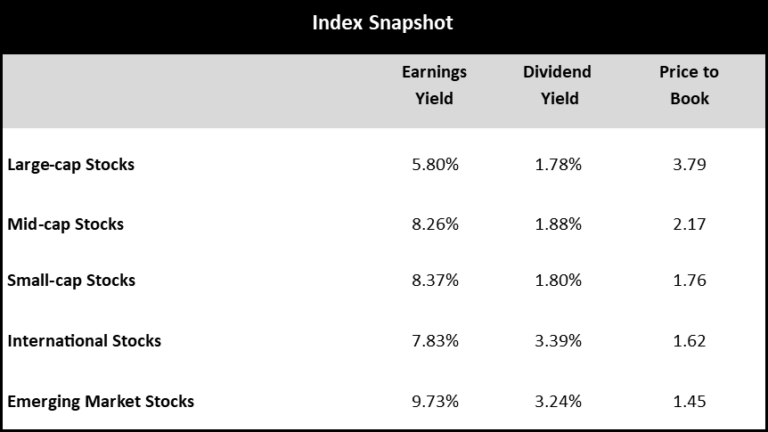
Core Equities
Since our last report, equity prices have recovered from the interest rate induced declines in 2022. After adjusting for recessionary recovery, we believe equities are fairly valued relative to historical valuations. Given recessionary risks and the inverted yield curve, we would not overweigh equities beyond investor risk determined allocations. Given our inflation and valuation outlook, we are also more constructive on small cap and international equities.
Tactical Equities
Due to the extreme conditions in core fixed income and equity markets, we think that tactical equity strategies may offer investors the best risk/reward tradeoffs. Tactical equity strategies, like long/short equity and option-based strategies have historically weathered bad bond markets and buffered bad equity market storms. We believe tactical equity strategies are becoming increasingly attractive on a relative value basis given economic volatility and the likely structural changes to the economy.
Other Markets
Other markets like gold, cryptocurrency, and real estate may offer diversification benefits to traditional portfolios, but some suffer from the same valuation issues as stocks and bonds.
FinTrust Allocations (70/30 Risk Profile) with Tactical
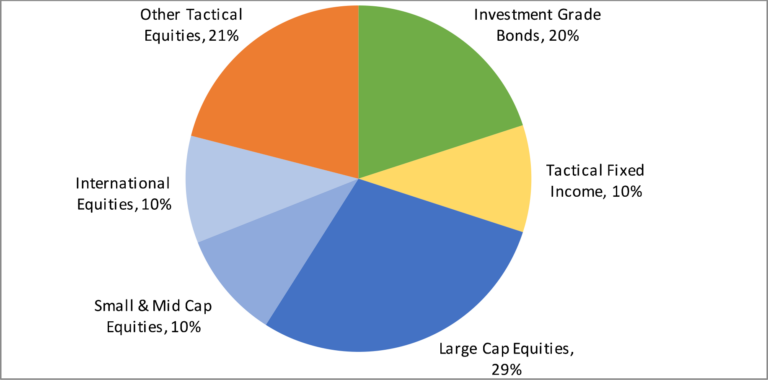
Positioning as of 12/31/2022. This model displays FinTrust’s Funds & ETF Model with Tactical target portfolio guidelines. Each client situation is unique and may be subject to special circumstances, including but not limit to greater or less risk tolerance, classes, concentrations of assets not managed by FinTrust, investment limitations imposed under applicable governing documents, and other limitations that may require adjustments to the suggested allocations. Model asset allocation guidelines may be adjusted from time to time on the basis of the foregoing and other factors.
About FinTrust Capital Advisors, LLC
FinTrust Capital Advisors is a wholly owned registered investment advisory subsidiary of United Community Banks, Inc. that serves both personal wealth clients and corporate and institutional clients. Fintrust offers strategic financial planning, investment management, fiduciary and retirement plan consulting, research, capital markets, and other services concerning financial well-being. The FinTrust team of experienced professionals provides solutions to meet both individual and corporate client objectives.
Important Disclaimer
Securities offered through FinTrust Brokerage Services, LLC (Member FINRA/ SIPC) and Investment Advisory Services offered through FinTrust Capital Advisors, LLC. Insurance services offered through FinTrust Insurance and Benefits, inc.. This material does not constitute an offer to sell, solicitation of an offer to buy, recommendation to buy or representation as the suitability or appropriateness of any security, financial product or instrument, unless explicitly stated as such. Past performance is not necessarily indicative of future returns. This information should not be construed as legal, regulatory, tax, or accounting advice. This material is provided for your general information. It does not take into account particular investment objectives, financial situations, or needs of individual clients. This material has been prepared based on information that FinTrust Capital Advisors believes to be reliable, but FinTrust makes no representation or warranty with respect to the accuracy or completeness of such information. Investors should carefully consider the investment objectives, risks, charges, and expenses for each fund or portfolio before investing. Views expressed are current only as of the date indicated, and are subject to change without notice. Forecasts may not be realized due to a variety of factors, including changes in economic growth, corporate profitability, geopolitical conditions, and inflation. The mention of a particular security is not intended to represent a stock-specific or other investment recommendation, and our view of these holdings may change at any time based on stock price movements, new research conclusions, or changes in risk preference. Index information is included to show the general trend in the securities markets during the periods indicated and is not intended to imply that any referenced portfolio is similar to the indexes in either composition or volatility. Index returns are not an exact representation of any particular investment, as you cannot invest directly in an index.