
Economic Vitals Signs
Q: Allen, why are you thinking about economic vital signs now?
In medicine, a physician or nurse takes vital signs because these are useful in detecting and monitoring medical problems. If a measurement veers outside of the standard or normal range, then the vital sign alerts the healthcare provider that there may be a particular type of issue. For example, a high temperature or fever may indicate infection. A low pulse reading may indicate that the heart’s electrical system is not functioning properly. Low pulse and blood pressure can lead to dizziness. Meanwhile, high blood pressure over time can lead to stroke, heart attack, and cognitive impairment. A rapid respiratory rate may be an indication of infection, anxiety, panic, or depression.
Just as our bodies have vital signs, so too does our economy. I am thinking about these economic vital signs now because many are showing extremes.
Q: Can you walk us through some of these economic vital signs?
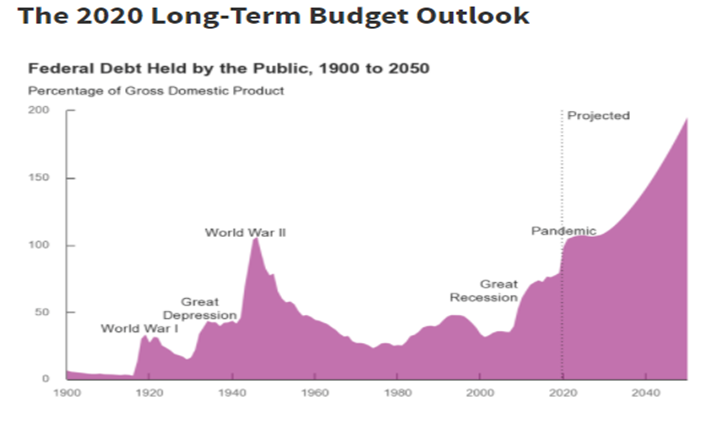
Sure. Normal body temperature resides between 97˚F and 99˚F. When temperatures rise above this level, it may indicate illness. In a manner similar to temperature, a country’s debt to GDP ratio rises when its economic growth and vitality are not sufficient to cover its spending. In most cases, this ratio increases slightly during recessions, but the major increases are reserved for times of war. When the debt to income ratio falls outside of standard ranges, this may indicate a potential illness of the system.
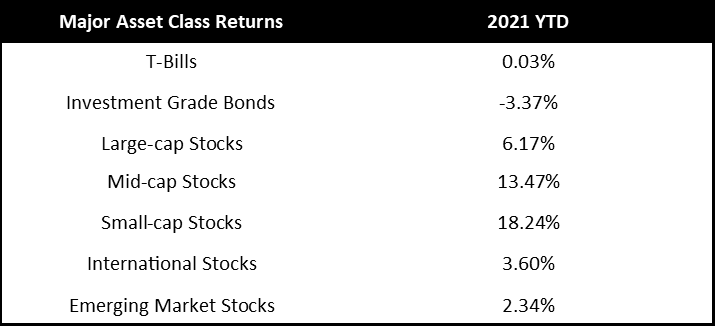
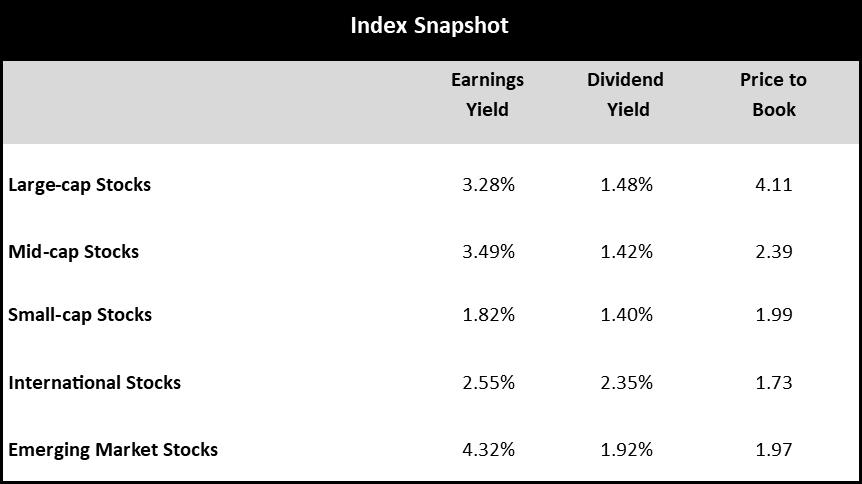
Source: Morningstar Direct, As of 3/31/2021
Allen Gillespie, CFA®, Managing Partner Investments
Mercer Treadwell, CFA®, Senior Vice President, Investment Advisor
David Lewis CFA®, Chief Financial Officer
Thomas Sheridan, Financial Analyst
Holland Church, Portfolio Administrator
EXECUTIVE SUMMARY
- Monetary Policy: Accommodative. The Federal Reserve has massively expanded its balance sheet and interest rates remain low.
- Fiscal Policy: Accommodative. With Democrats controlling both the White House and Congress, expectations are high for additional rounds of stimulus.
- Economic Vital Signs: high debt to GDP, low money velocity, high money supply growth, high anxiety, positive millennial demographics ahead.
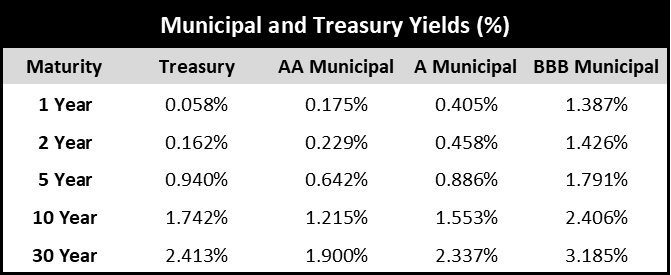
- Yield Curve Watch: Long-term interest rates are beginning to increase.
Currently, the United States debt to GDP ratio is 106%, its highest reading since World War II. Back then, the post-World War II recovery and high tax rates helped to lower the nation’s temperature over the course of about 20 years. Unfortunately, the Congressional Budget Office (“CBO”) is not projecting a repeat performance.
Just as some fevers subside on their own, some high debt to GDP countries do ok too. But some of history’s greatest economic calamities and currency devaluations were precluded by high and rising debt to GDP ratios. Today, the debt to GDP ratios for many countries, including the U.S., are indicating that we may be headed towards bad combinations of higher taxes, higher inflation, and devaluations. The global debt situation is certainly a risk worth monitoring closely, and the debt is part of the reason people remain interested in gold, silver, cryptocurrencies, and digital assets.
Q: What would be the economic equivalent to a pulse reading?
Your pulse measures your heart rate. A low heart rate may inhibit proper blood flow. It may also prevent oxygen from reaching critical organs like your brain resulting in confusion and dizziness. An economic equivalent to a pulse reading then would be the velocity of money. Money velocity measures a dollar’s flow through the economic system. In macroeconomics, money times monetary velocity equals gross domestic product (“GDP”) times the price level (MV = Py). Our current, historically low monetary velocity reading indicates that dollars are just not flowing through the system very well.
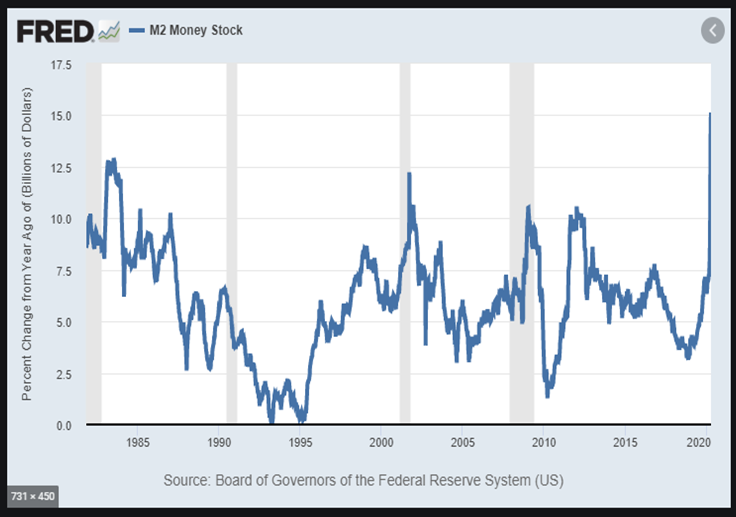
A low money velocity reduces the flow of money reaching individuals and businesses in the economy. The grey bars in the chart below indicate recessions. Falling velocity is generally associated with recession, as the economy gets dizzy and confused velocity drops. It is important to note, however, that monetary velocity in the U.S. has been failing to recover after each of the last three recessions. As a result, money velocity has been on a steady decline for over 20 years now.
Worse, money velocity continued to make new lows in the recovery period following the Global Financial Crisis. This lack of money velocity is part of the reason why economic inequality is so high in our country. Personally, I think the drop in velocity is related to the aging of our Baby Boomer population. Boomers make up 22% of the U.S. population, and as they have been approaching and entering retirement, their peak consumer spending years are behind them. The increasing role of government in the economy also plays a role in the drop in money velocity. Think of it this way: does money move faster when hundreds of millions of people make millions of daily financial decisions, or when 535 Congresspeople make decisions while working through a legislative process?
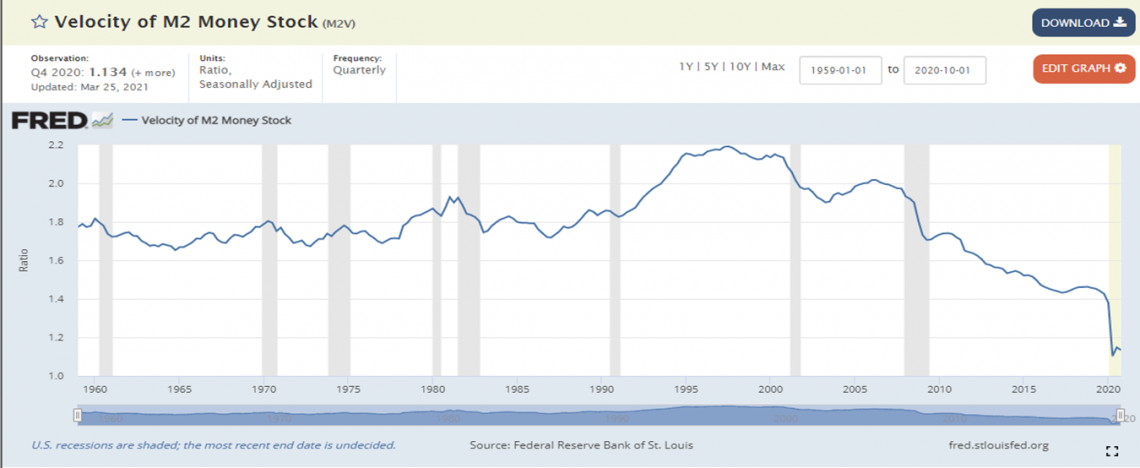
“A low monetary velocity indicates that dollars are just not flowing through the system very well.”
Source: Bloomberg as of 3/31/2021
Q&A with the Research Team
Q: How is the economy’s blood pressure?
It is really, really high based on surveys of the electorate and charts of money supply growth. Year-over-year money supply growth was north of 15% at year-end in 2020, and in early 2021 it is up over 20% per year, the highest in at least 5 decades. Obviously, much of this money creation was needed due to the Covid shutdowns, but the need was greater because of the shutdowns. This monetary inflation is a form of indirect taxation because people would probably find direct taxation for all the spending unacceptable. In a normal year federal government tax revenue might be $3.6 Trillion and the deficit nearly $1 Trillion (implying taxes would need to be 27% higher) but in 2020 the deficit was a record $3.13 Trillion. If we covered this spending directly, taxes would be nearly 100% higher than current rates.
Q: What are the ramifications of a high economic blood pressure?
Think of the money supply growth as your base inflation rate, but then recall our previous money velocity chart. We are printing the dollars, but they are not flowing through the economy very well. The two items are working in opposite directions as the moment. As a result, only a few people at the heart of the economy are benefiting. I believe Bitcoin and cryptocurrencies are reacting to this money supply pressure, while gold and silver will be more reactive to the money velocity if it begins to flow into physical goods and services.
If the U.S. economy were a patient, the patient would have a low pulse and high blood pressure, which is a rare occurrence. In medicine, this condition can occur due to beta blocker medications. An economic equivalent to beta blockers might be a health order or a regulation that blocks free commerce.
Q: How would you measure the economy’s respiratory rate?
A high respiratory rate may be an indication of panic, anxiety, or depression. If that is the case, then the 2020 report on the nation’s mental health put out by the pharmacy benefit manager Express Scripts is concerning. Express Scripts reports that prescriptions for anti-anxiety medications increased 34.1%, anti-depressants prescriptions increased 18.6%, and anti-insomnia drugs prescriptions increased 14.8%.
Good mental health is critical to good health and good economic decision-making. As a result, I think policymakers really need to consider mental health impacts, in addition, to physical health when determining pandemic responses.
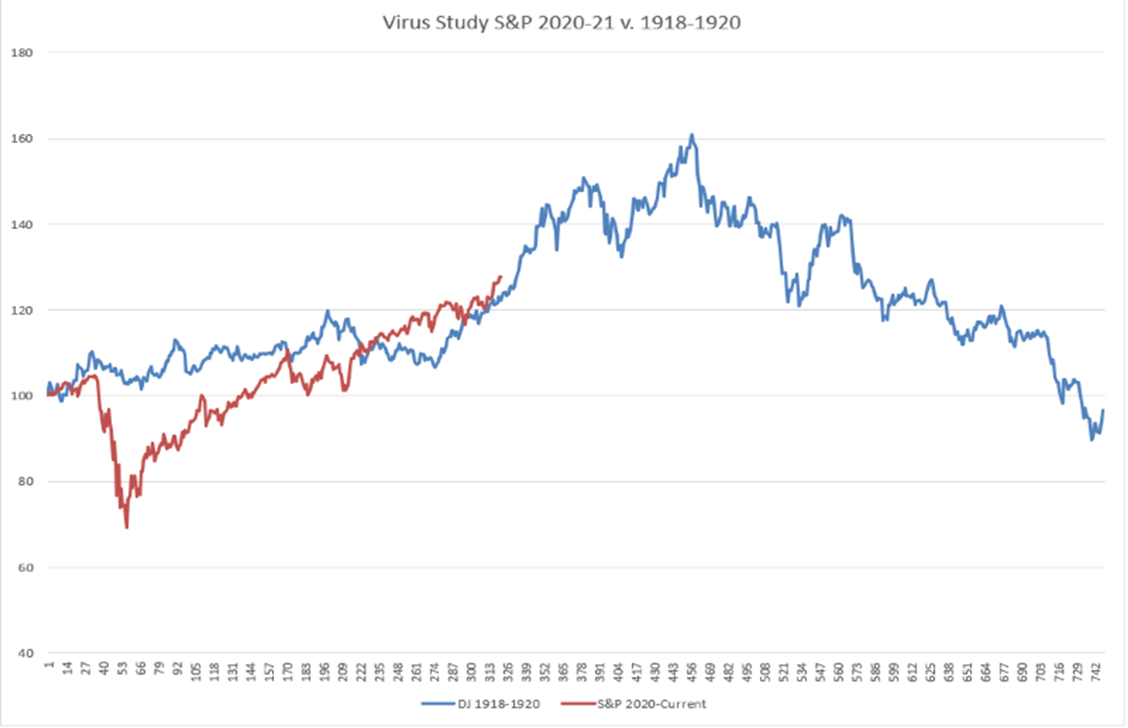
Here’s the really sad part of all the pandemic shutdowns. From the stock market’s perspective, it really has not altered the outcome. Here is a chart I created which compares the Dow Jones Industrial Average for the Spanish flu year of 1918 to 1920 to the S&P 500 since the end of 2019 through today (4/12/21). I think these two charts are so similar because it is estimated that the Spanish flu killed 675,000 Americans and that to date Covid-19 has killed 562,000. Today’s population is nearly 3x as large as the 1918 population, but from a stock market perspective the markets reacted harder in 2020 than in 1918. In short, to financial markets, commerce matters more than health.
Q: Allen, you have made the case that our economic vitals look troublesome, is there any hope doc?
Absolutely. With the right diet, exercise, and medication, I think we can bring some of these numbers back into normal ranges. The key issue with economic vital signs is not where they are, but rather where are they heading. By the end of 2022, I think enough millennials will be far enough into their careers that the economy will start shifting back towards health for a long time. We could experience another roaring 20s starting in a few years.
Away from the headlines, I see businesses intellectual property and innovation accelerating. I see millennials starting to buy homes and start families.
If there is one millennial trend that I have seen playing out repeatedly it is this: Incumbency is not an advantage. Millennials are driving demand for electric cars. Millennials are demanding healthier food.
In the end, I think the decentralization and globalization can co-exist. This creates an exciting world of opportunities.
Quick Take
Major Asset Classes
Cash and Cash Equivalents
Cash rates now sit near zero, but markets are beginning to project a future rise in short-term rates following the 2022 elections. As a result, we believe alternative currencies like gold and cryptocurrency offer positive carry against cash. Given some quantitative studies we have seen we are particularly interested in silver.
Investment Grade Fixed Income
Investment grade fixed income markets have been under pressure as interest rates have risen since the first of the year. Now that 10-year treasury yields are at least equal to 10-year realized inflation rates, we are incrementally more constructive on in-vestment grade fixed income. Given the still historically low levels, however, we still believe investment grade bonds will be a challenging asset class. We think investment grade bonds still have a defensive roll to play, but we would not expect capital appreciation from bonds going forward.
Tactical Fixed Income
Historically, fixed income and equity arbitrage strategies earn a risk premium above cash yields. Given that equity market neutral strategies historically are positively correlated to higher interest rates, we continue to favor these types of strategies.
Core Equities
Since our last report, equity prices have appreciated materially on fiscal stimulus and economic re-openings. As a result, even after adjusting for recessionary recovery, we believe equities are slightly overvalued relative to historical valuations. As a result, we are modestly constructive on equities. Given high levels of volatility, we would not overweight equities beyond investor risk determined allocations. Given our inflation outlook, we are also more constructive on small cap and international equities.
Tactical Equities
Due to the extreme conditions in core fixed income and equity markets, we think that tactical equity strategies may offer investors the best risk/reward tradeoffs. Tactical equity strategies, like long/short equity and option-based strategies have historically weathered bad bond markets and buffered bad equity market storms. We believe tactical equity strategies are becoming increasingly attractive on a relative value basis given low interest rates and the likely structural changes to the economy.
Other Markets
Other markets like gold, cryptocurrency, and real estate may offer diversification benefits to traditional portfolios, but some suffer from the same valuation issues as stocks and bonds. We are concerned that recent events will accelerate trends towards online purchasing and remote work, which will increasingly pressure certain real estate sectors. In addition, outside markets have their own risks, rewards, and implementation issues, but they may have a role depending on investor-specific considerations.
Source: Bloomberg as of 3/31/2021
FinTrust Allocations (70/30 Risk Profile) with Tactical
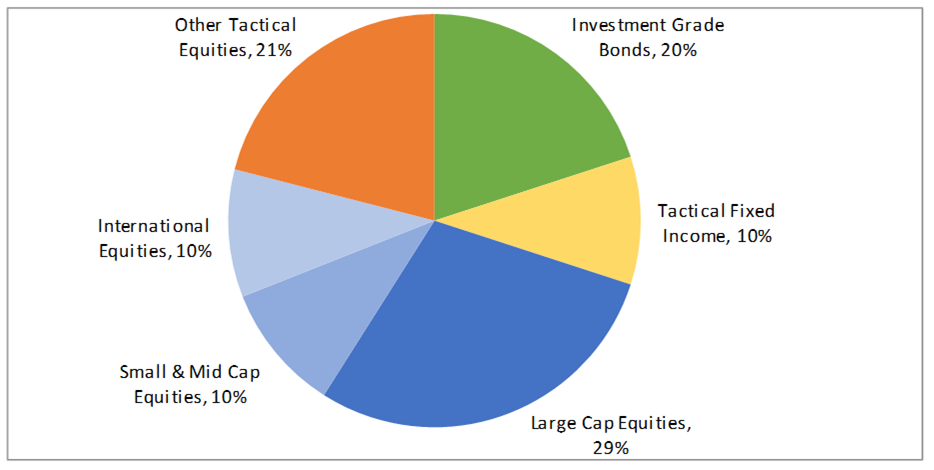
Positioning as of 12/31/2020. This model displays FinTrust’s Funds & ETF Model with Tactical target portfolio guidelines. Each client situation is unique and may be subject to special circumstances, including but not limit to greater or less risk tolerance, classes, concentrations of assets not managed by FinTrust, investment limitations imposed under applicable governing documents, and other limitations that may require ad-justments to the suggested allocations. Model asset allocation guidelines may be adjusted from time to time on the basis of the foregoing and other factors.
About FinTrust Capital Advisors, LLC
Privately owned and independent, FinTrust Capital Advisors is a Southeastern based financial services firm that serves both personal wealth clients and corporate and institutional clients. FinTrust offers strategic financial planning, investment management, fiduciary and retirement plan consulting, research, capital markets, and other services concerning financial well-being. The FinTrust team of experienced professionals provides solutions to meet both individual and corporate client objectives.
Important Disclaimer
Securities offered through FinTrust Brokerage Services, LLC (Member FINRA/ SIPC) and Investment Advisory Services offered through FinTrust Capital Advisors, LLC. Insurance services offered through FinTrust Capital Benefit Group, LLC. This material does not constitute an offer to sell, solicitation of an offer to buy, recommendation to buy or representation as the suitability or appropriateness of any security, financial product or instrument, unless explicitly stated as such. Past performance is not necessarily indicative of future returns. This information should not be construed as legal, regulatory, tax, or accounting advice. This material is provided for your general information. It does not take into account particular investment objectives, financial situations, or needs of individual clients. This material has been prepared based on information that FinTrust Capital Advisors believes to be reliable, but FinTrust makes no representation or warranty with respect to the accuracy or completeness of such information. Investors should carefully consider the investment objectives, risks, charges, and expenses for each fund or portfolio before investing. Views expressed are current only as of the date indicated, and are subject to change without notice. Forecasts may not be realized due to a variety of factors, including changes in economic growth, corporate profitability, geopolitical conditions, and inflation. The mention of a particular security is not intended to represent a stock-specific or other investment recommendation, and our view of these holdings may change at any time based on stock price movements, new research conclusions, or changes in risk preference. Index information is included to show the general trend in the securities markets during the periods indicated and is not intended to imply that any referenced portfolio is similar to the indexes in either composition or volatility. Index returns are not an exact representation of any particular investment, as you cannot invest directly in an index.