
SUMMARY
- A Narrow Market Broadens in the Final Quarter
- Expect the Yield Curve to Normalize in 2024
- Presidential Election Years – “Open Field” v. “Incumbent Led” Markets
Portfolio Commentary
Written by Allen Gillespie, CFA®, Chief Investment Officer
A Narrow Market Broadens in the Final Quarter
In our last Portfolio Commentary, we detailed the historical tendency for small capitalization stocks to begin a recovery just after a Federal Reserve rate hiking cycle ends, and prior to the end of a recession. We also noted how the recovery then continues for the subsequent 1-year and 5-year periods. As if on que, the equity markets began following the script in the fourth quarter as the Federal Reserve’s last rate hike was in July 2023. The small capitalization S&P 600 index gained 14.41% in the year’s final three months and outperformed the large capitalization S&P 500’s 11.24% gain for the quarter.
For the full year, the large capitalization stocks were still the winner, but in the fourth quarter the cycle seems to have turned. Large capitalization stocks returned an impressive 26.44% in 2023. The gain enabled the index to recover the 19.44% decline of 2022, but the gains were highly concentrated within the “Magnificent Seven” stocks: Apple, Google (“Alphabet”), Microsoft, Amazon, Meta, Tesla, and Nvidia. According to S&P, the Magnificent Seven stocks gained 104.7% on average in 2023 and accounted for 62.2% of the large cap index performance. This was a strong recovery after their worse than market performance in 2022, when they declined 45.31% on average. The Magnificent Seven benefited from the excitement associated with the development and rollout of artificial intelligence applications (“AI”).
Some additional commentary on the Magnificent Seven, and large capitalization stocks in general. The FOMO (“Fear of Missing Out”) with these seven stocks appears to us to be very high but also understandable. AI is a very real feature of the modern economy, and these seven companies are clearly leaders in the AI field. In certain cases, we also find the valuations to be reasonable. These seven companies are all excellent at what they do. The risks, however, are that the amount of computing power necessary to run AI applications is high and expensive. Furthermore, the historical record is not kind to investors who just blindly buy stocks without consideration for valuations and risks, or to groups of stocks which take on common language monikers.
For example, the 1920s bull market was led by “one-decision” stocks like General Motors, General Electric, and U.S. Steel. At the time, it was clear to investors that the future of America contained cars, steel, and would include electronics and electricity. While these stocks all produced solid multi-decade track records from the 1920s forward, they still had to traverse the lean years of the 1929 crash and the Great Depression years.
Similarly, the 1960s and early 1970s gave rise to the original “Nifty-Fifty” stocks. Since that time, the Nifty-Fifty stocks long-term performance as a group has been solid, but it also has not been a straight line. For example, they lost over 50% of their value during the inflationary driven bear market of 1973-1974, after which many did not regain their peaks until Paul Volker tamed inflation in the 1980s. The Nifty-Fifty contained many household names like McDonalds, but there were also many technology names on the list. In fact, in looking at the underlying investment themes, the Nifty-Fifty appears remarkably similar to the Magnificent Seven of today.
For example, Polaroid and Eastman Kodak (film, cameras, and pictures) were replaced by Apple’s camera phones and Meta’s Facebook and Instagram. Texas Instruments is still with us, but Nvidia has the hot AI chips. IBM has transformed itself into a consulting business, as mainframe computers lost market share to personal computers loaded with Microsoft’s Windows. Large department store company Kresge/Kmart was felled by Wal-Mart. Wal-Mart, in turn, has been surpassed in market cap by Amazon’s pioneering efforts into online shopping. Telsa is leading the move toward electrification and advanced manufacturing, whereas General Electric was previously synonymous with manufacturing and electrification. In 1900, 38% of cars were electric while the remainder were powered by steam and gasoline. In years past, Xerox helped the world to copy and distribute information, whereas much of that activity is now online in Adobe’s PDFs and Meta’s Facebook and Instagram social media posts, likes, and shares. Google and Amazon Web Services have led the world into “hosting” webservices and software as a service (“SAAS”) much like how IBM, Burroughs (now Unisys), and Digital Equipment leased computer time back in the 1960s and 1970s.
The 1990s internet boom similarly gave rise to the “four horsemen” stocks: Microsoft, Cisco, Intel, and Dell. While all four of these stocks and companies are still around, Microsoft is the only one that still regularly comes up in investor conversations.
We write all this not because we are negative towards the Magnificent Seven, as the long-term track performance record of “one-decision” companies is acceptable. We write the commentary to remind our readers of the following:
- The record suggests broad diversification is important in “The Battle for Investment Survival” as Gerald Loeb named it.
- High and rising interest rates have a history of killing even the strongest bull markets.
- Volatility comes with the territory, even for the best companies.
- According to the Economist magazine, Taiwan produces over 65% of the world’s semi-conductor chips and over 90% of the advanced ones, so the U.S. tech sector has a huge supply chain dependency in an age of geopolitical uncertainty.
- Valuations matter.
Expect the Yield Curve to Normalize
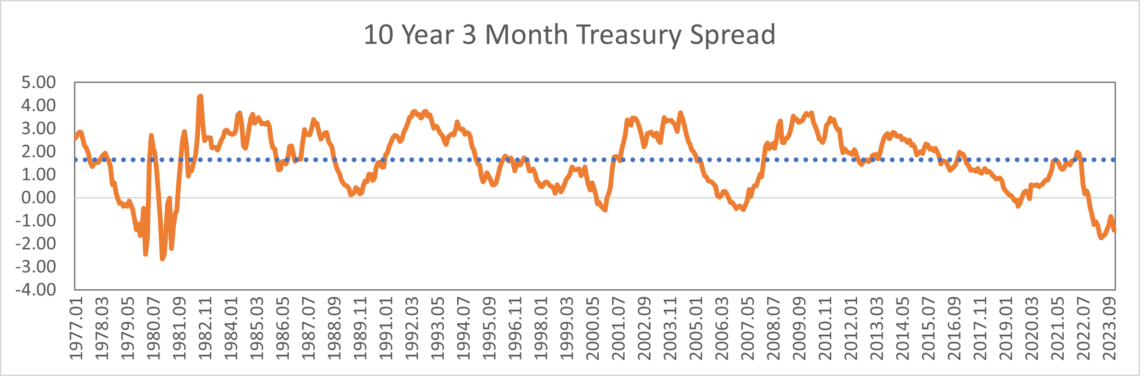
The yield curve (a measure of short-term interest rates v. long-term interest rates), as measured by the 10-year treasury bond minus the 3-month treasury, has historically averaged 1.65%. The Federal Reserve’s aggressive stance towards inflation has pushed short-term interest rates to 5.33%. Meanwhile, investor confidence in the “soft-landing” of inflation scenario has led investors to chase long-term interest rates down to the sub-4% area. As one can see in the chart above, similar yield curve inversions occurred prior to the recession of the early 1980s, early 1990s, early 2000s, the housing crisis of 2008, and Covid induced recession. In fact, this is the most inverted yield curve since the election year of 1980.
Looking further back to the Spanish flu period, after a surge in inflation and interest rates during the pandemic, government interest rates did gradually decline to the 3% area. They would, however, surge higher later in the decade. It should be noted, however, that government indebtedness during that period was insignificant and that the British lost world currency reserve status during the decade. Meanwhile, during that period, AAA Corporate Bond yields, as recorded by Moody’s, ranged between 4.5% and just over 6.5%. It is our impression from the data that short-term interest rates are currently too high and long-term interest rates are currently too low. As a result, we expect the yield curve to normalize in 2024. We also would not be surprised to see that a yield curve normalization creates some equity market rotation and disruption.
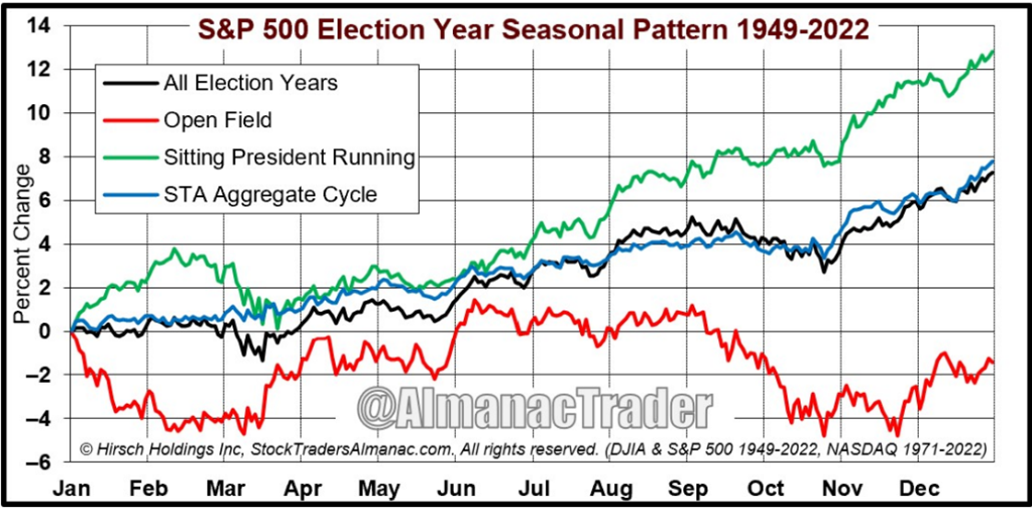
Presidential Election Years – “Open Field” v. “Incumbent Led” Markets
The Stock Trader’s Almanac for 2024 contains an interesting chart regarding Presidential Election year market biases. In “open field” years, markets are forced to deal with higher uncertainty. As a result, “open field” years historically experience two bouts of weakness: early year weakness as candidates emerge and additional weakness around the election itself as outcomes are determined. In contrasts, sitting Presidents have an incumbent advantage, winning over 65% of the time, so when there is an incumbent running, market performance tends to be smoother. In this regard, 2024 presents some interesting dynamics.
There is an incumbent running, however, his age is clearly a question. Additionally, the historical record for how many Presidents elected in a year ending in zero finish their term is not good. In fact, over 63% have failed to finish out their term due to natural death or assassination. The pattern has been broken since Reagan survived being shot. Historically, this has been attributed to the Curse of Tippecanoe. (https://en.wikipedia.org/wiki/Curse_of_Tippecanoe). On the incumbent’s side, there is also a third-party candidate in Kennedy, so one might argue that it is really an “open field” election.
There have also been rumors that Mark Cuban is preparing for a Presidential run. He recently sold part of his stake in the Dallas Mavericks to Mariam Adelson and her family for a reported $2 billion. It should be noted that Sheldon Adelson, the founder of Las Vegas Sands, was a prominent Republican party funder. The move, however, could just be related to sports as the Adelson interests also have a stake in an international basketball team. The Adelson interests also purchased a large land tract near the Dallas arena, possibly for an eventual casino and entertainment related business.
In addition to an aging President and third-party candidates, Democratic District Attorneys and officials continue to try a variety of legal maneuvers to either bring legal cases against Trump or to remove him from election ballots. Trump meanwhile continues to make the public case against “election fraud” and “interference.” While many may dismiss such claims, the following article details at least 12 cases, on both sides of the aisle, where people have been successfully prosecuted for election related interference and fraud. Meanwhile, a judge in Wisconsin just ruled that mobile absentee voting vans like those funded by the Center for Tech and Civic Life (CTRL) are illegal. It has been reported that Mark Zuckerberg contributed over $400 million to CTRL during the 2020 election cycle.
https://www.zerohedge.com/political/voter-fraud-convictions-challenge-narrative-secure-electionswhere
https://apnews.com/article/wisconsin-racine-absentee-voting-van-16e07f54c595013ffeeb190c706ba4d8
Needless to say, these factors led us to conclude that there is a significant probability that regardless of who wins the Presidential election, investors will be facing some election year uncertainty. As a result, we are more inclined to believe that if the markets follow typical election year bias, it will look like an “open field” election. We will know more about what the markets are discounting at the end of the first quarter.
Portfolio Outlook and Actions
Fixed Income
We expect the yield curve to normalize in 2024. As a result, we believe investors should be prepared to add duration and credit exposure at some point during the year. We expect investment grade corporate bonds to remain range bound. As of December, Moody’s reports that BAA bonds (the low end of investment grade securities) yielded 5.64%. Over the last 100 years, corporate bonds yields have averaged 6.8%, so fixed income market yields are now just lower than long-term data series. As a result, we believe fixed income investors should consider gradually increasing their investment grade credit exposure as the yield curve straightens itself out.
Equities
As mentioned in our last commentary, the Russell 2000 small cap index met the minimum expectations for a recession. As a result, we believe investors should begin adding to their small cap stock exposure in anticipation of a future upturn. During the 1980 election cycle, the yield curve straightened out, and equity markets finished on election day at roughly the same place as they had begun during Jimmy Carter’s term. We note that at the time of Joe Biden’s inauguration, the small capitalization Russell 2000 ETF (IWM) closed at $214.39 and as of January 12, 2024, it trades for $193.23. A similar result of the yield curve straightening, and equity market election year rally, would imply that the small cap index could rally close to 11% between now and election day. While compelling, we would also encourage patience as buying weakness v. chasing strength would appear appropriate given the election year uncertainty.
Thank you for the trust you have placed in us. As always, if you have further questions, please do not hesitate to contact your FinTrust investment advisor.
Sincerely,
Your FinTrust Investment Team
Key Index Performance (As of 12/31/23)
| Index | QTD | YTD | 12M |
|---|---|---|---|
| S&P 500 (Large Capitalization Equity) | 11.69 | 26.29 | 26.29 |
| S&P 400 (Midcap Equity) | 11.67 | 16.44 | 16.44 |
| S&P 600 (Small Cap Equity) | 15.12 | 16.05 | 16.05 |
| S&P 500 Growth Stocks | 10.09 | 30.03 | 30.03 |
| S&P 500 Value Stocks | 13.63 | 22.23 | 22.23 |
| S&P GSCI (Commodities) | -4.08 | -4.13 | -4.13 |
| S&P U.S. Aggregate Bond Index | 6.23 | 5.81 | 5.81 |
| Balanced Weighting (60/40) | 9.51 | 18.10 | 18.10 |
| S&P Sectors | QTD | YTD | 12M |
|---|---|---|---|
| Energy | -6.35 | -0.59 | -0.59 |
| Utilities | 8.56 | -7.08 | -7.08 |
| Consumer Staples | 5.37 | -0.79 | -0.79 |
| Health Care | 6.41 | 2.06 | 2.06 |
| Industrials | 13.05 | 18.13 | 18.13 |
| Materials | 9.68 | 12.54 | 12.54 |
| Financials | 14.03 | 12.15 | 12.15 |
| Real Estate | 18.83 | 12.36 | 12.36 |
| Information Technology | 17.71 | 56.13 | 56.13 |
| Communication Services | 11.04 | 53.04 | 53.04 |
| Consumer Discretionary | 11.33 | 39.81 | 39.81 |
*Source: S&P Dow Jones Indices
Important Disclaimer
Securities offered through FinTrust Brokerage Services, LLC (Member FINRA/ SIPC) and Investment Advisory Services offered through FinTrust Capital Advisors, LLC. Insurance services offered through FinTrust Capital Benefit Group, LLC. This material does not constitute an offer to sell, solicitation of an offer to buy, recommendation to buy or representation as the suitability or appropriateness of any security, financial product or instrument, unless explicitly stated as such. Past performance is not necessarily indicative of future returns. This information should not be construed as legal, regulatory, tax, or accounting advice. This material is provided for your general information. It does not take into account particular investment objectives, financial situations, or needs of individual clients. This material has been prepared based on information that FinTrust Capital Advisors believes to be reliable, but FinTrust makes no representation or warranty with respect to the accuracy or completeness of such information. Investors should carefully consider the investment objectives, risks, charges, and expenses for each fund or portfolio before investing. Views expressed are current only as of the date indicated, and are subject to change without notice. Forecasts may not be realized due to a variety of factors, including changes in economic growth, corporate profitability, geopolitical conditions, and inflation. The mention of a particular security is not intended to represent a stock-specific or other investment recommendation, and our view of these holdings may change at any time based on stock price movements, new research conclusions, or changes in risk preference. Index information is included to show the general trend in the securities markets during the periods indicated and is not intended to imply that any referenced portfolio is similar to the indexes in either composition or volatility. Index returns are not an exact representation of any particular investment, as you cannot invest directly in an index.