
SUMMARY
- The Leading Economic Index (“LEI”) and Small Cap Russell 2000 Index Confirm Recessionary Signal
- Small Cap Stocks Historically Bottom During Recessions and Fed Cycles
- Small Cap Stock Returns are Typically Higher for Extended Periods Following Recession
Portfolio Commentary
Written by Allen Gillespie, CFA®, Chief Investment Officer
Programming Economics – The LEI and Small Cap Russell 2000 Index Confirm Recessionary Signal
Investors today easily recognize that computers and algorithms drive much of our world. Algorithms provide driving directions, movie selections, curated places to visit, and lists of books to read. The investing world is no different, and algorithmic investing strategies now control trillions of investment dollars. Rarely, however, do we pause to consider how those algorithms might be programmed. This Portfolio Commentary provides a quick look at how a computer program might be coded to reflect economics, and where the computers suggest we are in the cycle.
The Economic Concepts
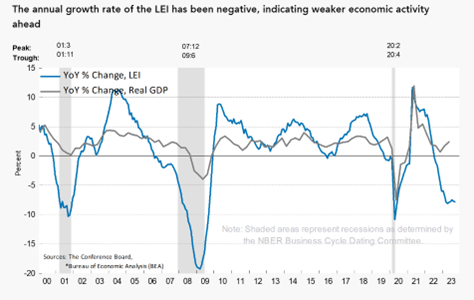
The Conference Board is a non-profit economic research group which maintains various economic data series including the leading, co-incident, and lagging economic indices. The Leading Economic Index (“LEI”) provides an early indication of significant turning points in the business cycle and where the economy is heading in the near term. The LEI is down 3.4 percent over the six-month period ending September and since April 2022, it has been experiencing a year and a half of consecutive monthly declines. As one can see in the chart below, such declines are consistent with prior recessions, so the Conference Board currently expects a shallow recession in the first half of 2024.
Meanwhile, the economics literature historically defines a recession as the following:
“A recession is a significant, widespread, and prolonged downturn in economic activity. A common rule of thumb is that two consecutive quarters of negative gross domestic product (GDP) growth mean recession, although more complex formulas are also used.” – Investopedia
Stocks as a Leading Indicator
The stock market is included in the Conference Board’s Index of Leading Economic Indicators. Equity prices frequently top before a recession and bottom before the end of a recession, as market participants discount better conditions in the future. A broad measure of the domestic economy is the Russell 2000 index of small capitalization companies.
Programming A Recession
In the case of recession, a computer programmer for an investment firm or bank might therefore consider the following:
- A recession is the decline for at least two consecutive quarters in broad measures of economic activity.
- Equities are a leading indicator.
- There are roughly 20 trading days in each month, so two quarters would equal 120 trading days.
As a result, a minimum expectation of the stock market indicating a recession should be that a broad measure of equity market performance, like the Russell 2000, trade at a new 120 day low. This condition was met by the Russell 2000 on Oct. 19, Oct. 20, and Oct. 23rd. Consequently, we conclude that the stock market is starting to price in a recession, but we do not yet know the depth and duration of that recession.
Small Cap Stocks Historically Bottom During Recession and Fed Cycles
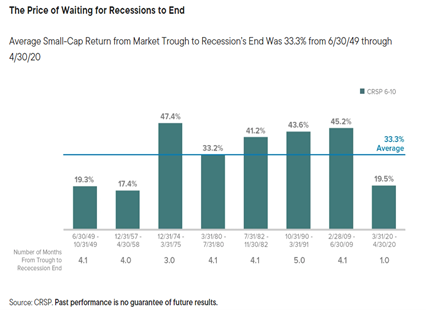
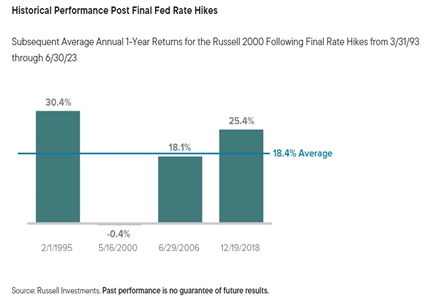
In an August 8, 2023 research paper titled, “Are US small caps ready for a handoff from bear to bull?” Royce Investment Partners, a small-cap manager with 50+ years of experience investing in small cap companies, shares two interesting charts. The first chart reports that the average small cap return from trough to recession’s end was 33.3% since 1949. The second chart shows that small cap performance following Federal Reserve tightening cycles also has been historically strong. At this point, the Federal Reserve’s last rate hike was on July 27, 2023.
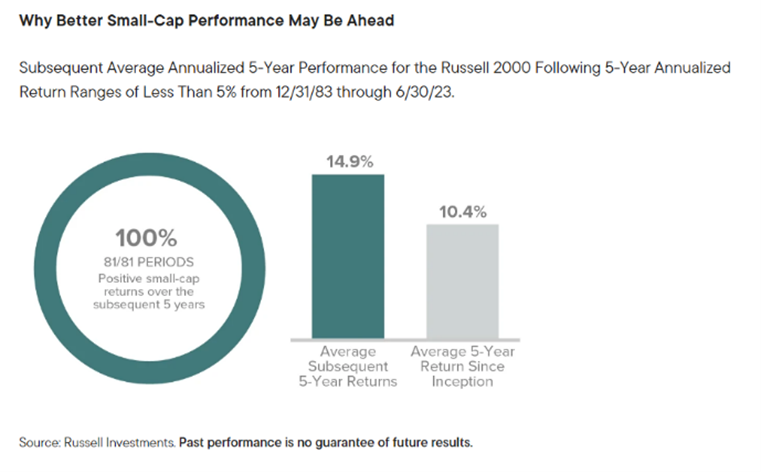
Small Cap Stock Returns are Typically Higher for Extended Periods Following Recession
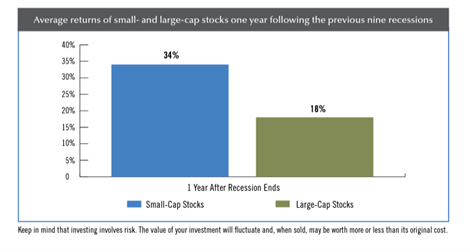
According to a 2007 research report from Prudential, small cap stocks have historically outperformed large capitalization stocks following recessions. Meanwhile, the Royce Investment Partners August 2023 research article suggests that 5-year subsequent small cap returns are higher following extended periods of below average returns.
Portfolio Outlook and Actions
Fixed Income
At the end of September, Moody’s reports that BAA bonds (the low end of investment grade securities) yielded 6.11%. Over the last 100 years, corporate bonds yields have averaged 6.8%, so fixed income market yields are now consistent with the long-term data series. As a result, we believe fixed income investors should consider gradually increasing their investment grade credit exposure.
Equities
As previously mentioned, the Russell 2000 small cap index met the minimum expectations for a recession. As a result, we believe investors should begin the process of adding to their small cap stock exposure in anticipation of a future upturn.
Thank you for the trust you have placed in us. As always, if you have further questions, please do not hesitate to contact your FinTrust investment advisor.
Sincerely,
Your FinTrust Investment Team
Key Index Performance (As of 6/30/23)
| Index | QTD | YTD | 12M |
|---|---|---|---|
| S&P 500 (Large Capitalization Equity) | -3.27 | 13.07 | 19.65 |
| S&P 400 (Midcap Equity) | -4.20 | 4.27 | 13.59 |
| S&P 600 (Small Cap Equity) | -4.93 | 0.81 | 8.13 |
| S&P 500 Growth Stocks | -2.59 | 18.11 | 18.35 |
| S&P 500 Value Stocks | -4.09 | 7.56 | 19.71 |
| S&P GSCI (Commodities) | 6.03 | -0.05 | 0.32 |
| S&P U.S. Aggregate Bond Index | -2.65 | -0.38 | 1.24 |
| S&P 500 Sectors | QTD | YTD | 12M |
|---|---|---|---|
| Energy | 12.22 | 6.03 | 30.41 |
| Utilities | -9.25 | -14.41 | -7.02 |
| Consumer Staples | -5.97 | -4.76 | 5.94 |
| Health Care | -2.65 | -4.09 | 8.18 |
| Industrials | -5.16 | 4.50 | 24.58 |
| Materials | -4.76 | 2.61 | 18.05 |
| Financials | -1.13 | -1.65 | 11.73 |
| Real Estate | -8.90 | -5.45 | -1.84 |
| Information Technology | -5.64 | 34.72 | 39.46 |
| Communication Services | 3.07 | 40.43 | 38.38 |
| Consumer Discretionary | -4.80 | 26.6 | 14.16 |
*Source: S&P Dow Jones Indices
Important Disclaimer
Securities offered through FinTrust Brokerage Services, LLC (Member FINRA/ SIPC) and Investment Advisory Services offered through FinTrust Capital Advisors, LLC. Insurance services offered through FinTrust Capital Benefit Group, LLC. This material does not constitute an offer to sell, solicitation of an offer to buy, recommendation to buy or representation as the suitability or appropriateness of any security, financial product or instrument, unless explicitly stated as such. Past performance is not necessarily indicative of future returns. This information should not be construed as legal, regulatory, tax, or accounting advice. This material is provided for your general information. It does not take into account particular investment objectives, financial situations, or needs of individual clients. This material has been prepared based on information that FinTrust Capital Advisors believes to be reliable, but FinTrust makes no representation or warranty with respect to the accuracy or completeness of such information. Investors should carefully consider the investment objectives, risks, charges, and expenses for each fund or portfolio before investing. Views expressed are current only as of the date indicated, and are subject to change without notice. Forecasts may not be realized due to a variety of factors, including changes in economic growth, corporate profitability, geopolitical conditions, and inflation. The mention of a particular security is not intended to represent a stock-specific or other investment recommendation, and our view of these holdings may change at any time based on stock price movements, new research conclusions, or changes in risk preference. Index information is included to show the general trend in the securities markets during the periods indicated and is not intended to imply that any referenced portfolio is similar to the indexes in either composition or volatility. Index returns are not an exact representation of any particular investment, as you cannot invest directly in an index.