
SUMMARY
- ChatGPT & Artificial Intelligence’s Potential and Buybacks Spark Technology Stock Rebound.
- Cap-weighted equity index versus equal-weighted equity index performance is close to extremes.
- Federal Reserve Rate Hiking Cycles – the historical record and the modern economy.
- Bonds Yields May Be Competitive Against Equities for Long-Term Investors
Portfolio Commentary
Written by Allen Gillespie, CFA®, Chief Investment Officer
ChatGPT & Artificial Intelligence Potential and Buyback Spark Technology Stock Rebound
ChatGPT launched publicly at the end of November. It quickly became the fastest application ever to reach 1 million downloads. It reached this impressive milestone in just five days. Over the subsequent eight months, over 100 million users have signed up for the service, and 1.6 billion people have visited the company’s website. The application has created immense excitement for the market because artificial intelligence applications may ultimately drive significant productivity gains. As a result, companies like Nvidia, which produces advanced semiconductor chips, have powered the market indices higher. In fact, Nvidia has reached the $1 trillion market cap level, making it the fourth largest company in the market. Other large technology stocks have also participated in the stock market gains on the back of their large stock buyback programs.
As a result, stock market indices are now dominated by the weightings of just a few mega-cap technology stocks. The top stocks, Apple, Microsoft, Nvidia, Alphabet (Google), and Tesla, now account for over 18% of market capitalization, the largest concentration in the history of the index.
Cap-Weighted Equity Index v. Equal Weighted Equity Index Performance is Close to Extremes
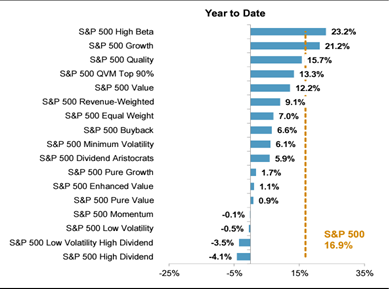
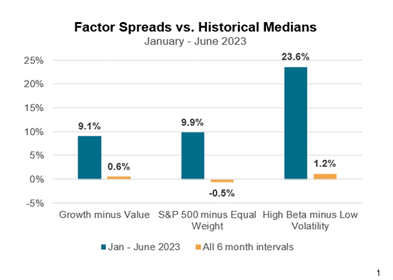
The U.S. equity market now finds itself at an interesting point. Year-to-date, high beta stocks are leaping higher, while dividend-paying stocks are down as they struggle to compete with higher interest rates. In addition, the performance difference between the cap-weighted and equal-weighted benchmarks is close to extremes. The difference between the cap weight index minus the equal weight index, 9.9% in the second chart below, is in the 98th percentile according to the Standard & Poor’s index committee.
Source: S&P Indices
Federal Reserve Rate Hiking Cycles – the Historical Records and the Modern Economy
Federal Reserve interest rate activity obviously impacts the interest rate and economically sensitive areas of the equity markets the most. The public equity market, as reflected in equity market capitalizations, however, is now dominated by technology and communications-related businesses which do not borrow as much money. As a result, these businesses are less directly interest-rate sensitive than companies in other sectors like real estate, banking, energy, industrials, and materials. The large difference in the equity market sector and market capitalization performance is therefore understandable given the fact that the Federal Reserve, based on the 12-month rate of change in the Fed Funds rate, is just now completing a historically large interest rate hiking cycle. As detailed in our last update, the yield curve, which has historically inverted prior to recessions, is now at one of its most inverted positions in history. The difference between longer-term interest rates and short-term interest rates implies that the Federal Reserve will be cutting interest rates 5 to 6 times over the intermediate time horizon.
In reviewing the historical record, equity market corrections are common following the end of the Federal Reserve interest rate hiking cycles. At the same time, the stock market has historically bottomed three to six months before the end of recessions. From our personal experience, the downturn following the popping of the internet bubble may provide a guide for the following reasons. First, the internet became everything people were excited about at the time. Over the long term, the performance of technology stocks has driven long-term equity market performance. Despite that, there was a bubble burst in conjunction with a change in the shape of the yield curve, which coincided with a large technology stock downturn. The internet bubble bust created a hard rotation to both bonds and small-cap value stocks during the period. During the 2000-2002 downturn, more stocks went up than went down, but the cap-weighted market indices went down because of the large influence of a handful of technology-related companies. Given some of the extremes now present in the data, we would not be surprised by a similar rotation. If just 10% moved out of the market capitalizations of Apple and Microsoft, then re-invested in $1 billion sized companies, 550 of them could double in price.
The chart below compares 2-year and 10-year treasury yields against the dividend and earnings yield for the stock market. One will immediately see that short-term bond yields have only been this competitive against equity market yields in three periods over the last 25 years. Despite their yield advantage from 1996-2002, bonds initially underperformed equities because of the internet bubble run-up (1996-2000). Then during the 2000-2002 downturn, bond yields kept the pressure on equity markets despite the declines. Similarly, during the housing market run-up, real estate investors ignored rising bond yields in the 2003-2007 period, but investors can easily remember what happened in 2008, a period now called “The Great Financial Crisis.”
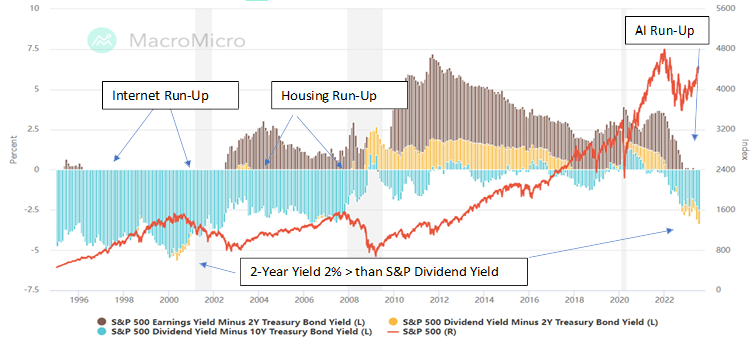
We believe the emergence of artificial intelligence technologies has created investor excitement similar to the internet days and housing bubble run-ups. We understand the interest and excitement, and we can make a case for a continued run-up in technology stocks. At the same time, given the current configurations in the data, we believe maintaining broad diversification across markets and investing styles is also highly important. The data suggests that the inflection in the yield curve and interest rate cycle might broaden equity market performance. In addition, the relative difference in yields suggests that over time, bond returns might prove to be competitive against equities for long-term investors.
Corporate Bonds
At the end of June, Moody’s reported that BAA bonds (the low end of investment grade securities) yielded 5.75%. The issue with corporate bonds, however, is that they carry credit risk, so one must decide whether today’s spread is adequate compensation for both the inflation and credit risk associated with corporate bonds. Credit risks will tend to increase and manifest if the economy experiences a recession. Historically, the low-end of investment-grade corporate bonds have offered about 1.92% more than 10-year treasuries, which ended the month at 3.75%, so corporate spreads have returned to long-term historical averages.
Stocks
At the end of June, the earnings yield on the S&P 500 index of large company stocks registered 3.94%, according to Gurufocus.com. Given the risks to earnings during a recession, many investors are questioning whether equities are still appropriate for their portfolios since they can make 5% on T-bills and CDs. The issue, of course, is that CD yields are only good for the term offered (i.e., one year), while equities’ earnings, even with a recession, have historically doubled every 7-10 years. As a result, we estimate equities currently offer investors returns in the 5.8%-7.0% per year range over a 7-10-year period. While this compares favorably against treasury bonds, the math is not as clear when compared to the low-end of investment-grade corporate bonds, which now yield 5.75%.
Summary
All of the above leads to the following conclusions.
- Artificial Intelligence technologies have rightfully created excitement for potential productivity gains, and the run-up in technology stocks may continue.
- Even if true, however, equity markets might still experience strong sector and capitalization rotations.
- Corporate bond yields would appear to be competitive in the long run against both equities and treasuries.
Portfolio Outlook and Actions
In a fixed-income portfolio, we believe investors should consider increasing their allocations to credit-related strategies. While technology stocks might continue to power equity market performance for a period, we recommend that investors seek some allocations to a broader basket of smaller companies. A basket of small companies could potentially materially benefit from even small capitalization adjustments within the equity markets.
Thank you for the trust you have placed in us. As always, if you have further questions, please do not hesitate to contact your FinTrust investment advisor.
Sincerely,
Your FinTrust Investment Team
Key Index Performance (As of 6/30/23)
| Index | QTD | YTD | 12M |
|---|---|---|---|
| S&P 500 (Large Capitalization Equity) | 8.74 | 16.89 | 19.59 |
| S&P 400 (Midcap Equity) | 4.85 | 8.84 | 17.61 |
| S&P 600 (Small Cap Equity) | 3.38 | 6.03 | 9.75 |
| S&P 500 Growth Stocks | 10.59 | 21.25 | 18.25 |
| S&P 500 Value Stocks | 6.64 | 12.15 | 19.99 |
| S&P GSCI (Commodities) | -2.73 | -7.54 | -14.22 |
| S&P U.S. Aggregate Bond Index | -0.86 | 2.03 | -0.37 |
| Balanced Weighting (60/40) | 5.30 | 5.49 | 10.92 |
| S&P 500 Sectors | QTD | YTD | 12M |
|---|---|---|---|
| Energy | -0.89 | -5.52 | 18.08 |
| Utilities | -2.53 | -5.69 | -3.68 |
| Consumer Staples | 0.45 | 1.28 | 5.54 |
| Health Care | 2.95 | -1.48 | 5.37 |
| Industrials | 6.49 | 10.19 | 25.16 |
| Materials | 3.31 | 7.74 | 15.12 |
| Financials | 5.33 | -0.53 | 9.50 |
| Real Estate | 1.81 | 3.79 | -4.13 |
| Information Technology | 17.20 | 42.77 | 38.27 |
| Communication Services | 13.06 | 36.24 | 24.91 |
| Consumer Discretionary | 14.58 | 33.06 | -18.28 |
*Source: S&P Dow Jones Indices
Important Disclaimer
Securities offered through FinTrust Brokerage Services, LLC (Member FINRA/ SIPC) and Investment Advisory Services offered through FinTrust Capital Advisors, LLC. Insurance services offered through FinTrust Capital Benefit Group, LLC. This material does not constitute an offer to sell, solicitation of an offer to buy, recommendation to buy or representation as the suitability or appropriateness of any security, financial product or instrument, unless explicitly stated as such. Past performance is not necessarily indicative of future returns. This information should not be construed as legal, regulatory, tax, or accounting advice. This material is provided for your general information. It does not take into account particular investment objectives, financial situations, or needs of individual clients. This material has been prepared based on information that FinTrust Capital Advisors believes to be reliable, but FinTrust makes no representation or warranty with respect to the accuracy or completeness of such information. Investors should carefully consider the investment objectives, risks, charges, and expenses for each fund or portfolio before investing. Views expressed are current only as of the date indicated, and are subject to change without notice. Forecasts may not be realized due to a variety of factors, including changes in economic growth, corporate profitability, geopolitical conditions, and inflation. The mention of a particular security is not intended to represent a stock-specific or other investment recommendation, and our view of these holdings may change at any time based on stock price movements, new research conclusions, or changes in risk preference. Index information is included to show the general trend in the securities markets during the periods indicated and is not intended to imply that any referenced portfolio is similar to the indexes in either composition or volatility. Index returns are not an exact representation of any particular investment, as you cannot invest directly in an index.