
December 31, 2022
Industry: Diversified
Tracking ETF: SPDR Dow Jones Industrial ETF (DIA)
Index Overview: The Dow Jones Industrial Average is a 30-stock, price-weighted index that measures the performance of some of the largest U.S. companies. The index provides suitable sector representation with the exception of the transportation industry group and utilities sector, which are covered by the Dow Jones Transportation Average and the Dow Jones Utility Average, respectively. When Charles H. Dow first unveiled his industrial stock average on May 26, 1896, the stock market was not highly regarded. Prudent investors bought bonds, which paid predictable amounts of interest and were backed by real machinery, factory buildings, and other hard assets. Today, stocks are widely accepted as investment vehicles, even by conservative investors. The 30 stocks now in the Dow Jones Industrial Average are all major factors in their industries, and their stocks are widely held by individuals and institutional investors. Besides longevity, two other factors play a role in its widespread popularity: It is understandable to most people, and it reliably indicates the market’s basic trend. Sources: DJAverages.com and spindices.com
Analyst Notes: Analysis by Allen Gillespie, CFA (864) 288-2849
Are Stocks Too High to Buy?
A Bitcoin Gold Dow Theory & Benjamin Graham
Analysis of the Dow Jones Industrial Average ETF
In his investment classic, The Intelligent Investor, the father of security analysis Benjamin Graham endeavored to answer the following question:
“Is the stock market too high for conservative purchase?”
He recommends methods by which a defensive investor might determine the appropriate asset allocation and simple methods by which to value securities to develop long term return expectations. He defined a defensive investor as one that is “interested chiefly in safety plus freedom from bother.”
He also defined an “investor” and a “speculator” with his famous statement that “an investment operation is one which, upon thorough analysis, promises safety of principal and an adequate return. Operations not meeting these requirements are speculative.” He argued for a 50/50 split of funds between stocks and bonds for defensive investors unless the weight of the evidence suggested a tilt toward a 75/25 or 25/75 mix.
In this analysis, I seek to logically implement his recommendations by analyzing the Dow 30 by using data from ValueLine, MarketSmith, Bloomberg, Barron’s, and FinTrust while also adjusting for inflation by using Bitcoin, gold, and cryptocurrency staking rates to derive estimates of real prices.
Year-End 2022 Analyst Highlights
- My current analysis suggests levels below 33,427 on the Dow Jones Average would be considered below average. A level closer to 26,548 would represent low prices, and an index level of 40,305 would be considered rich in relation to past sales, earnings, book value, dividends, and forward analyst estimates. Given that the current risk-to-reward ratio is equally balanced, FinTrust is maintaining its HOLD rating for the Dow Jones Industrial Average exchange-traded fund (ETF symbol: DIA), as the market is currently 0.89% below the midpoint of my 2023 estimated price range.
- The data suggests an allocation for defensive investors of 50/50 currently, which is a 5% increase in the recommended equity allocation since my last report. As in years past, I would recommend that investors decrease or increase their equity allocations proportionately to where stocks trade relative to my estimated levels.
- During 2022, the tangible book value of the Dow took a significant jump to $7,439, so I am increasing my gold price target from $6,688 to $7,439. As in my prior reports, gold still appears undervalued relative to equities.
- Today’s estimated ranges for the Dow Jones Index, less my gold price target, yield an implied bitcoin target range of $25,707-$29,795, which is down slightly from last year’s estimated range of $29,794-$32,358. The decline in my estimated bitcoin price range is due to the increase in tangible book values combined with the price decline in stocks and the increase in interest rates. In contrast to last year’s report, however, the BTC price is now below, rather than above, my valuation estimates.
- As in my previous reports, the data suggests that for the “defensive investor,” reasonable allocations toward the common stocks of the Dow Jones Industrial Average levels appear appropriate and reasonable.
- For fixed-income investors, I am adjusting my recommendation away from inflation-protected and floating-rate bonds towards a more benchmark allocation which contains more fixed-rate securities. I remain concerned about credit quality; therefore, I continue to recommend only high-quality bonds, and for aggressive investors, I continue to recommend gold equities, gold, and cryptocurrency in place of short-term fixed-income and money market holdings.
Risks to the Recommendation:
- Risks include, but are not limited to, (1) Unanticipated changes in inflation, interest rates and industrial production (2) credit risk (3) regulatory, governmental, and tax law changes (4) product and business risks (5) the mere fact the future is uncertain (6) political risks (7) and all other risks normally associated with investments in common equities, gold, and cryptocurrencies.
FinTrust Recommendation
| Fintrust Rating: Target Price: Current Share Price Expected Return 52 Week Price Range | HOLD $403.05 $331.33 21.60% $286.62-369.50 |
Fintrust Brokerage Services, LLC rates companies a BUY, HOLD, SELL, or SHORT.
- A BUY rating is given when the security is expected to outperform the broad equity market as measured by the S&P 500 on a risk adjusted basis over the next year.
- A HOLD rating is given when the security is expected to perform in line with the broad equity market as measured by the S&P 500 on a risk adjusted basis over the next year.
- A SELL rating is given when the security is expected to perform below the broad equity market as measured by the S&P 500 on a risk adjusted basis over the next year.
- A SELL SHORT is given when the security is expected to decline in value over the next year.
The distribution of ratings across FinTrust’s entire company universe is 50% Buy, 33.3% Hold, 16.7%Sell, and 0% Short
Key Figures (Dow 30 @ 12/23/2022)
Key figures pricing data reflects previous trading day’s closing price. Other applicable data are trailing 12-months unless otherwise specified.
| R.O.A.E Earn $ Divs $ Book Value $ | 22.30% $1562.14 $687.40 $7439.45 |
| P/E (Actual) Earns Yield % Divs Yield % P/B | 21.2x 4.71% 2.07% 4.46x |
“Much like last year’s analysis, the current low levels of dividend and earnings yields and interest rates suggest a fair degree of caution. For the 52 weeks ending December 17, 2021, Barron’s reports the 12-month trailing earnings for the Dow 30 components at $1,602.94 v. $1023.05 for the prior year, paid dividends of $629.70, and an equity book decline to $6,543 from $6,688. Based on an earnings retention rate of 60.7% and a return on average equity of 24.23%, the implied expected book value growth for the next year would be a solid 14.71%, which, when added to an initial 1.75% dividend yield would lead to an expected 16.46% total return under average conditions. While impressive and consistent with historical ranges, I point out that earnings margins are not likely to stay elevated under inflationary conditions and interest rates remain severely depressed at a time when corporate and government debts are high, and currency values are in flux.
In expanding this analysis to the broader S&P 500 index, using data for book value, return on equity, dividends, and earnings returns, one finds that the S&P 500 companies experienced an earnings recovery with earnings rising to $158.75 from $99.23. Likewise, dividends rose on a year-over-year basis to $61.91 vs. the prior year’s $57.40. Meanwhile, average equity for the S&P 500 was $921 for the trailing 12 months, which when combined with the 61% earnings retention rate yields an expectation for book value growth of 10.51%. This 10.51% growth when added to the initial 1.36% yield leads to a total return expectation of 11.87% for the next twelve months.
My analysis suggests levels below 32,379 on the Dow Jones Industrial Average would be below the 10-year average, and levels closer to 25,713 would represent low prices relative to the average results, while an index level of 39,046 would be considered rich in relation to past sales, earnings, book value, dividends, and forward analyst estimates. The data suggests that for the “defensive investor,” reasonable allocations toward common stocks at today’s levels appear appropriate and reasonable. Given the components of the Dow 30 collectively appear to trade at slightly above average levels (36,338 v. 32,379 or 112.2% of average), portfolio policy for the “defensive investor” should lean toward average equity allocations (so if one normally splits funds in a 50/50 ratio, the analysis suggests a 45/55 ratio).”
In 2021, I pointed out that the asset inflationary price gap indicated that both equities and bonds might be mispriced.
“I estimate the asset price inflation monetary gap has created a mispricing of approximately 175-200 basis points (1.75-2.0%) across markets. I derived this estimate from two methods. First, I analyzed the relationship between short-term interest rates and various measures of inflation since the Federal Reserve’s inception. I would point out that while these measures have occasionally diverged, they tracked relatively closely until we entered the quantitative easing era. Today, the 10-year realized inflation rate by the Fed’s own measure stands at 1.82% v. an overnight rate of 8 bps for a difference of 1.74%.”
“It must be evident to the reader that I continue to find the stocks of the Dow Jones Industrial Average at today’s prices look better on average than taxable bonds given the spread between the expected total return on equities (16.46% and 11.87%% for the Dow and S&P) versus the (2.25%) yield on taxable bonds. I am more confident in the analysis now that earnings have declined to recessionary lows in 2020, but I remain concerned in my analysis given the suppressed nature of global interest rates, as both equities and bonds may be mispriced. Despite trading near the midpoint of my estimated range, the case for equities at today’s prices is still not so compelling when compared to high-quality bonds and alternatives as to lead a defensive investor to completely abandon balanced asset allocations in the search of a little more growth and income.”
What Has Happened Since My December 2021 Report
Since my 2021 report, stocks, bonds, and BTC have all declined as many of my concerns have come to fruition. The highest inflation readings in 40 years during 2021 finally forced the Federal Reserve to move towards closing the “asset price inflation monetary gap” I had addressed and estimated in my previous report. The closing of the asset price inflation monetary led to one of the worst bond market performances in history, caused equity markets to decline, increased Gold’s relative strength, and led to a large correction in cryptocurrencies with BTC falling 64%. At its lowest point during the year, the Dow Jones Industrial average declined to 28,660.94, or 12% below the middle of our estimated price range 2021. Meanwhile, the interest rate on 10-year government bonds rose by 2.367%.
The Investor and Inflation (Real v. Nominal Prices)
Investors should invest to increase or maintain the real purchasing power of their savings. In this effort, investors have traditionally used both technical and fundamental analysis to determine the appropriate prices for securities. Two of the oldest methods of analysis involve Dow Theory to determine the economy’s direction and a Benjamin Graham analysis of security values to determine the appropriate values for securities.
Beyond normal analysis difficulties, which prior methods sought to solve, the modern analyst must now also contend with the unprecedented degree of economic deformation wrought by central banks and central planners. Central bank policies target nominal prices, prevent distressed selling, and created a monetary hall of mirrors for asset prices. Nominal prices had separated from fundamental values by what I termed the “asset price inflation monetary gap,” which was the difference between where interest rates should be based on economic conditions and where they actually were set by monetary authorities.
Today’s asset price inflation, monetary gap, and the changing nature of the economy have distorted security analysis unless the modern analyst adjusts security values from nominal prices into real price equivalents and adjusts from controlled interest rates into free market equivalents.
The Quagmire of the Asset Price Inflation Monetary Gap – Repeated here from my 2021 report.
“Global central banks and treasury departments actively lend at subsidized rates. Until 2021, they were buying both fixed-income and equity securities with newly printed money on a near-daily basis. As a result, the Bank of Japan and the Swiss Central Bank now rank among the Top 10 holders of a broad range of equity securities. In its last 13-F filing, the Swiss National Bank reported holding 65,984,108 shares of Apple, 28,291,355 shares of Microsoft, 10,412,716 shares of Johnson & Johnson, 9,680473 shares of Proctor & Gamble, 6,689,519 shares of Visa, 3,731,426 shares of United Health Care, and 22,133,341 shares of Pfizer along with holdings in many other Dow Jones Index member securities. In the United States, Blackrock buys fixed-income ETFs on behalf of the US Treasury with money supplied by the Fed through special purpose entities.
Continuous and indiscriminate central bank asset purchases distort financial markets because central banks are infinite players, whereas individual investors have finite lives. Simon Sinek addresses Game Theory and the quagmire that results when infinite players play against finite players in this Google “The Finite and Infinite Games of Leadership|Simon Sinek|Talks at Google”:
In 2022, central banks reversed these policies because:
BTC Forced Competition – and Freed (ironic, no?) Investors from the Quagmire of Central Planning
In 2021, I stated the direction of cryptocurrencies was tied to “interest rate differentials” given that they fundamentally have smaller supply growth than fiat currencies like the USD. As central banks moved aggressively to reduce and eliminate the “asset price inflation monetary gap” – the interest rate differentially closed in favor of the USD. As a result, in classic carry trade fashion, cryptocurrencies suffered in 2021. Regarding, Sam Bankman Fried and the FTX scandal – I simply note the irony contained within his name (Samuel’s two sons in the bible in 1 Samuel 8:1-3 “turned aside after gain; they took bribes and perverted justice.” Was the Bank -Man – Fried? or Freed? and what of the large equity stake in Robinhood, and where did the money go? It is all recorded on the blockchain – and it is a decentralized system, so many people can check, and it has already been reported that FTX worked with Ukraine and SBF sought to be the largest democratic party donor. The market wiped out the FTX fraud the day after the election, and in a decentralized network – in my opinion, FTX will soon be forgotten just like few recall when Mt. Gox crumbled.
Estimating the Size of the Today’s Asset Price Inflation Monetary Gap
Today, I estimate the asset price inflation monetary gap has closed. While I believe the Federal Reserve has, in fact, raised interest rates too much, I do not believe it will be willing to admit this error until the 12-month CPI inflation rate is lower than nominal interest rates. I derived my estimates of where policy rates should be from two methods. First, I analyzed the relationship between short-term interest rates and various measures of inflation since the Federal Reserve’s inception. I would point out that while these measures have occasionally diverged, they tracked relatively closely until markets entered the quantitative easing era. Today, the 10-year realized inflation rate stands at 2.52% v. an overnight rate of 4.25%-4.50% for a difference of 1.73-1.98%. The second method I used to estimate the asset price inflation monetary gap involved comparing short-term interest rates to staking rates for the two largest cryptocurrencies.
Converting Equity Values into Real Prices
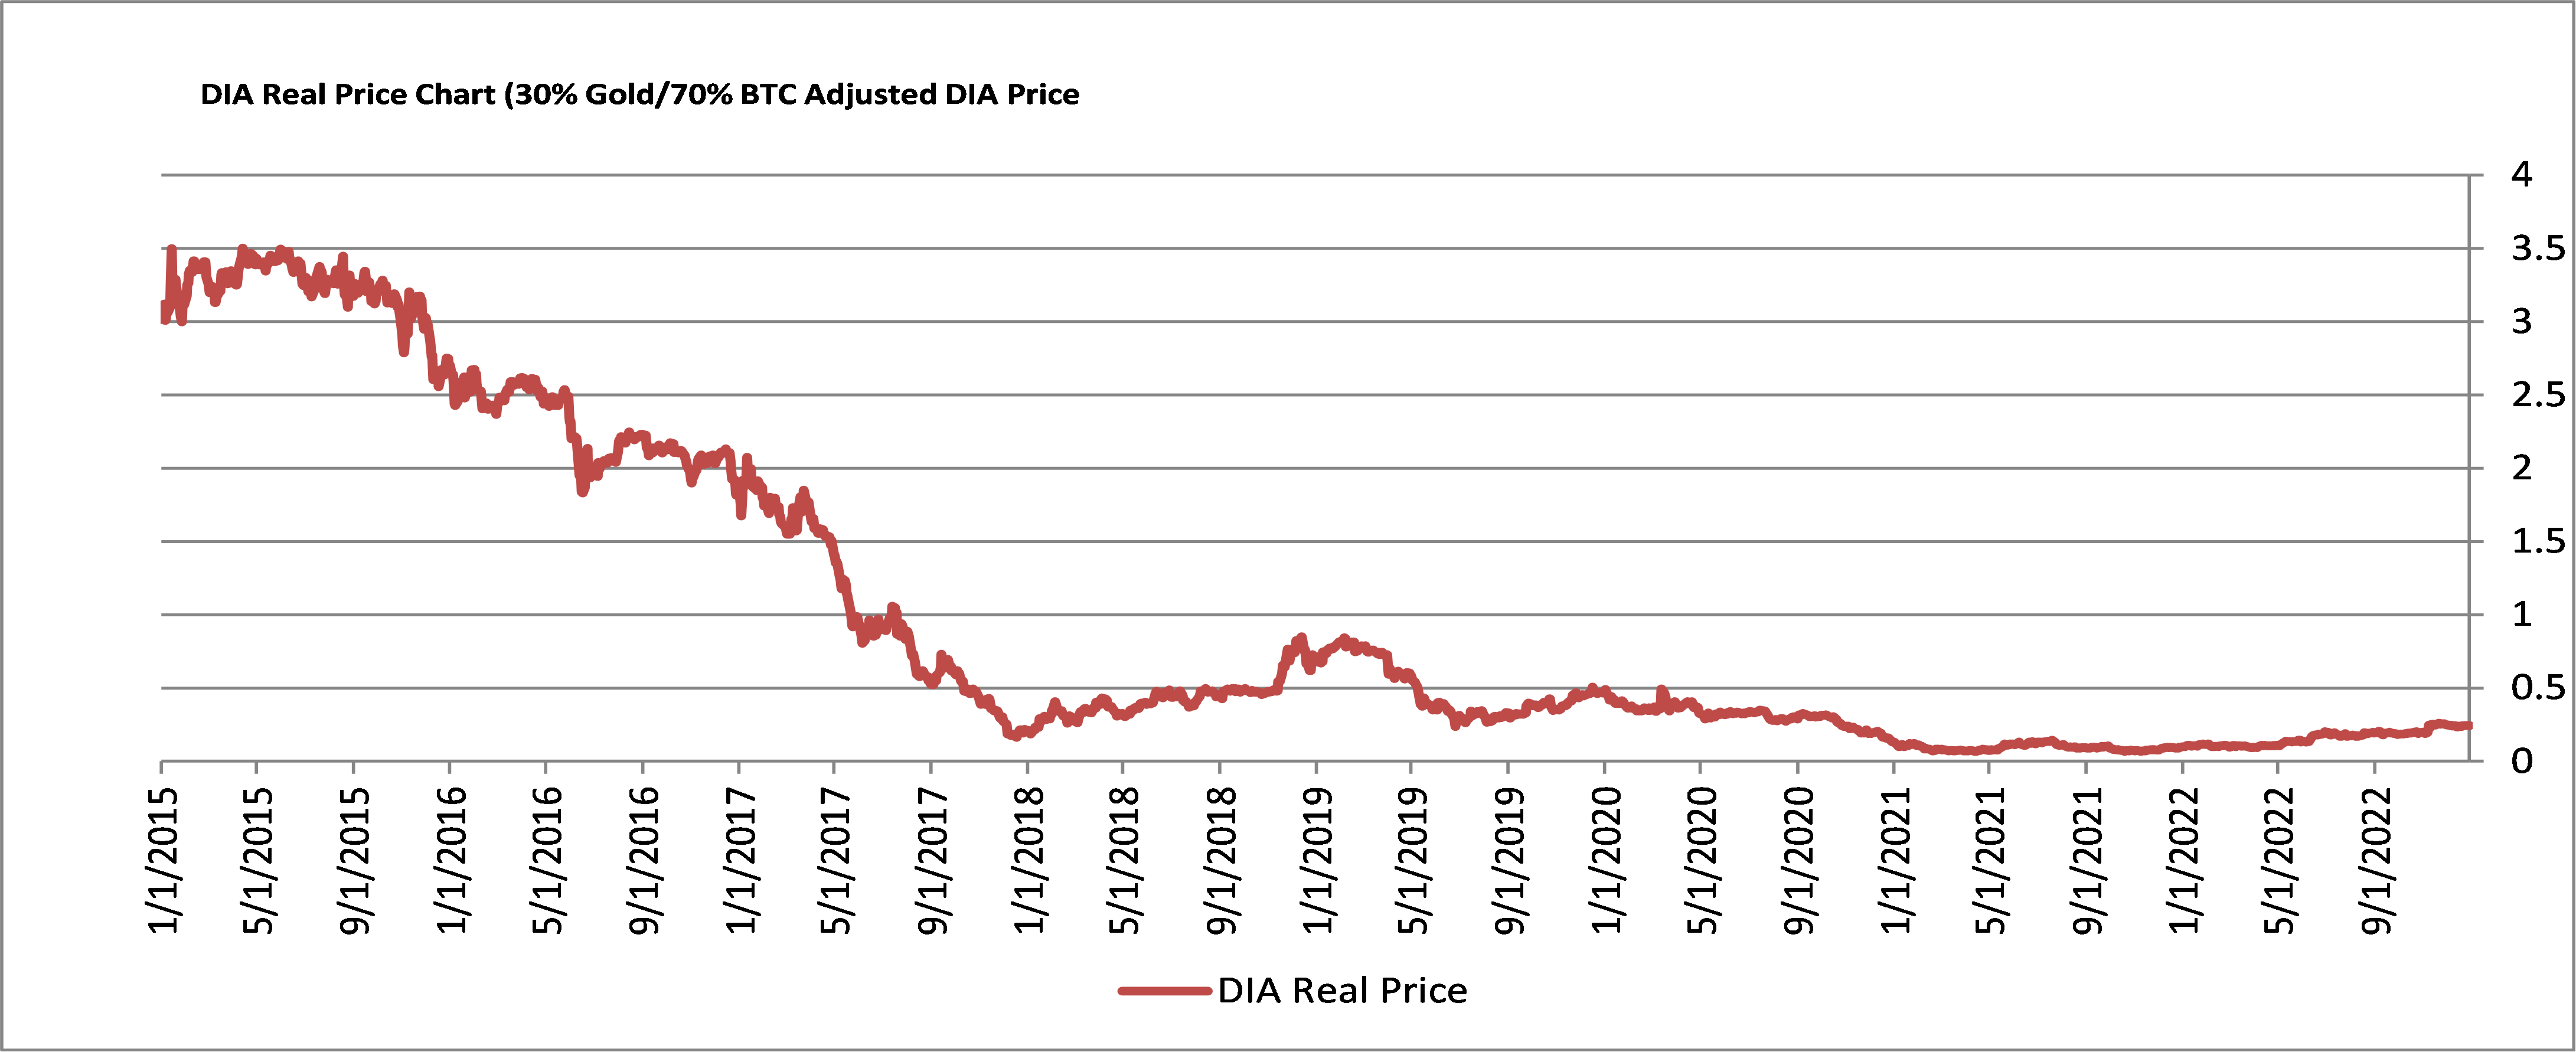
Historically, nominal to real price adjustments were straightforward. Consumer price goods baskets were relatively uniform, and other stores of value like gold and commodities had direct links to the industrial economy. Equity values were reflected in the share prices of the companies in the Dow Jones Industrial and Dow Jones Transportation Averages. The transition from an Industrial Economy to a Digital and Information Economy, however, created a gap that made real price measurement adjustments difficult. Software businesses like Microsoft simply do not need the same amounts of tangible property, plant, and equipment as industrial companies in order to drive business value. Fortunately, the universe created cryptocurrencies and thereby provided the modern analyst an additional tool for measuring real values. I believe real price estimates can now be obtained from nominal prices by conversions into gold for tangible assets and conversions into bitcoin for the goodwill, patents, trademark, network values, and other intangible assets associated with technology and service businesses.
Bitcoin, Gold, Dow Theory Framework
Under my BGDT Framework, first published in 2017, I postulated that the value of one gold coin, plus one bitcoin, will approximate the value of one Dow Jones share over time. In this framework, tangible book values and centrally directed interest rates are easily measured and change infrequently. Meanwhile intangible values like patents, trademarks, network effects, and inflationary values of more difficult to accurately price. Logically this suggests that the volatility of gold should be lower than the volatility of equities, the volatility of cryptocurrencies would be higher than equities, and the volatility of equities would reflect a blended volatility based on the ratio of tangible to intangible values of the businesses. A fourth factor in all asset values would be the asset price inflation monetary gap. Finally, the analyst must make a determination as to the appropriate discount rates to use.
Does this type of analysis work?
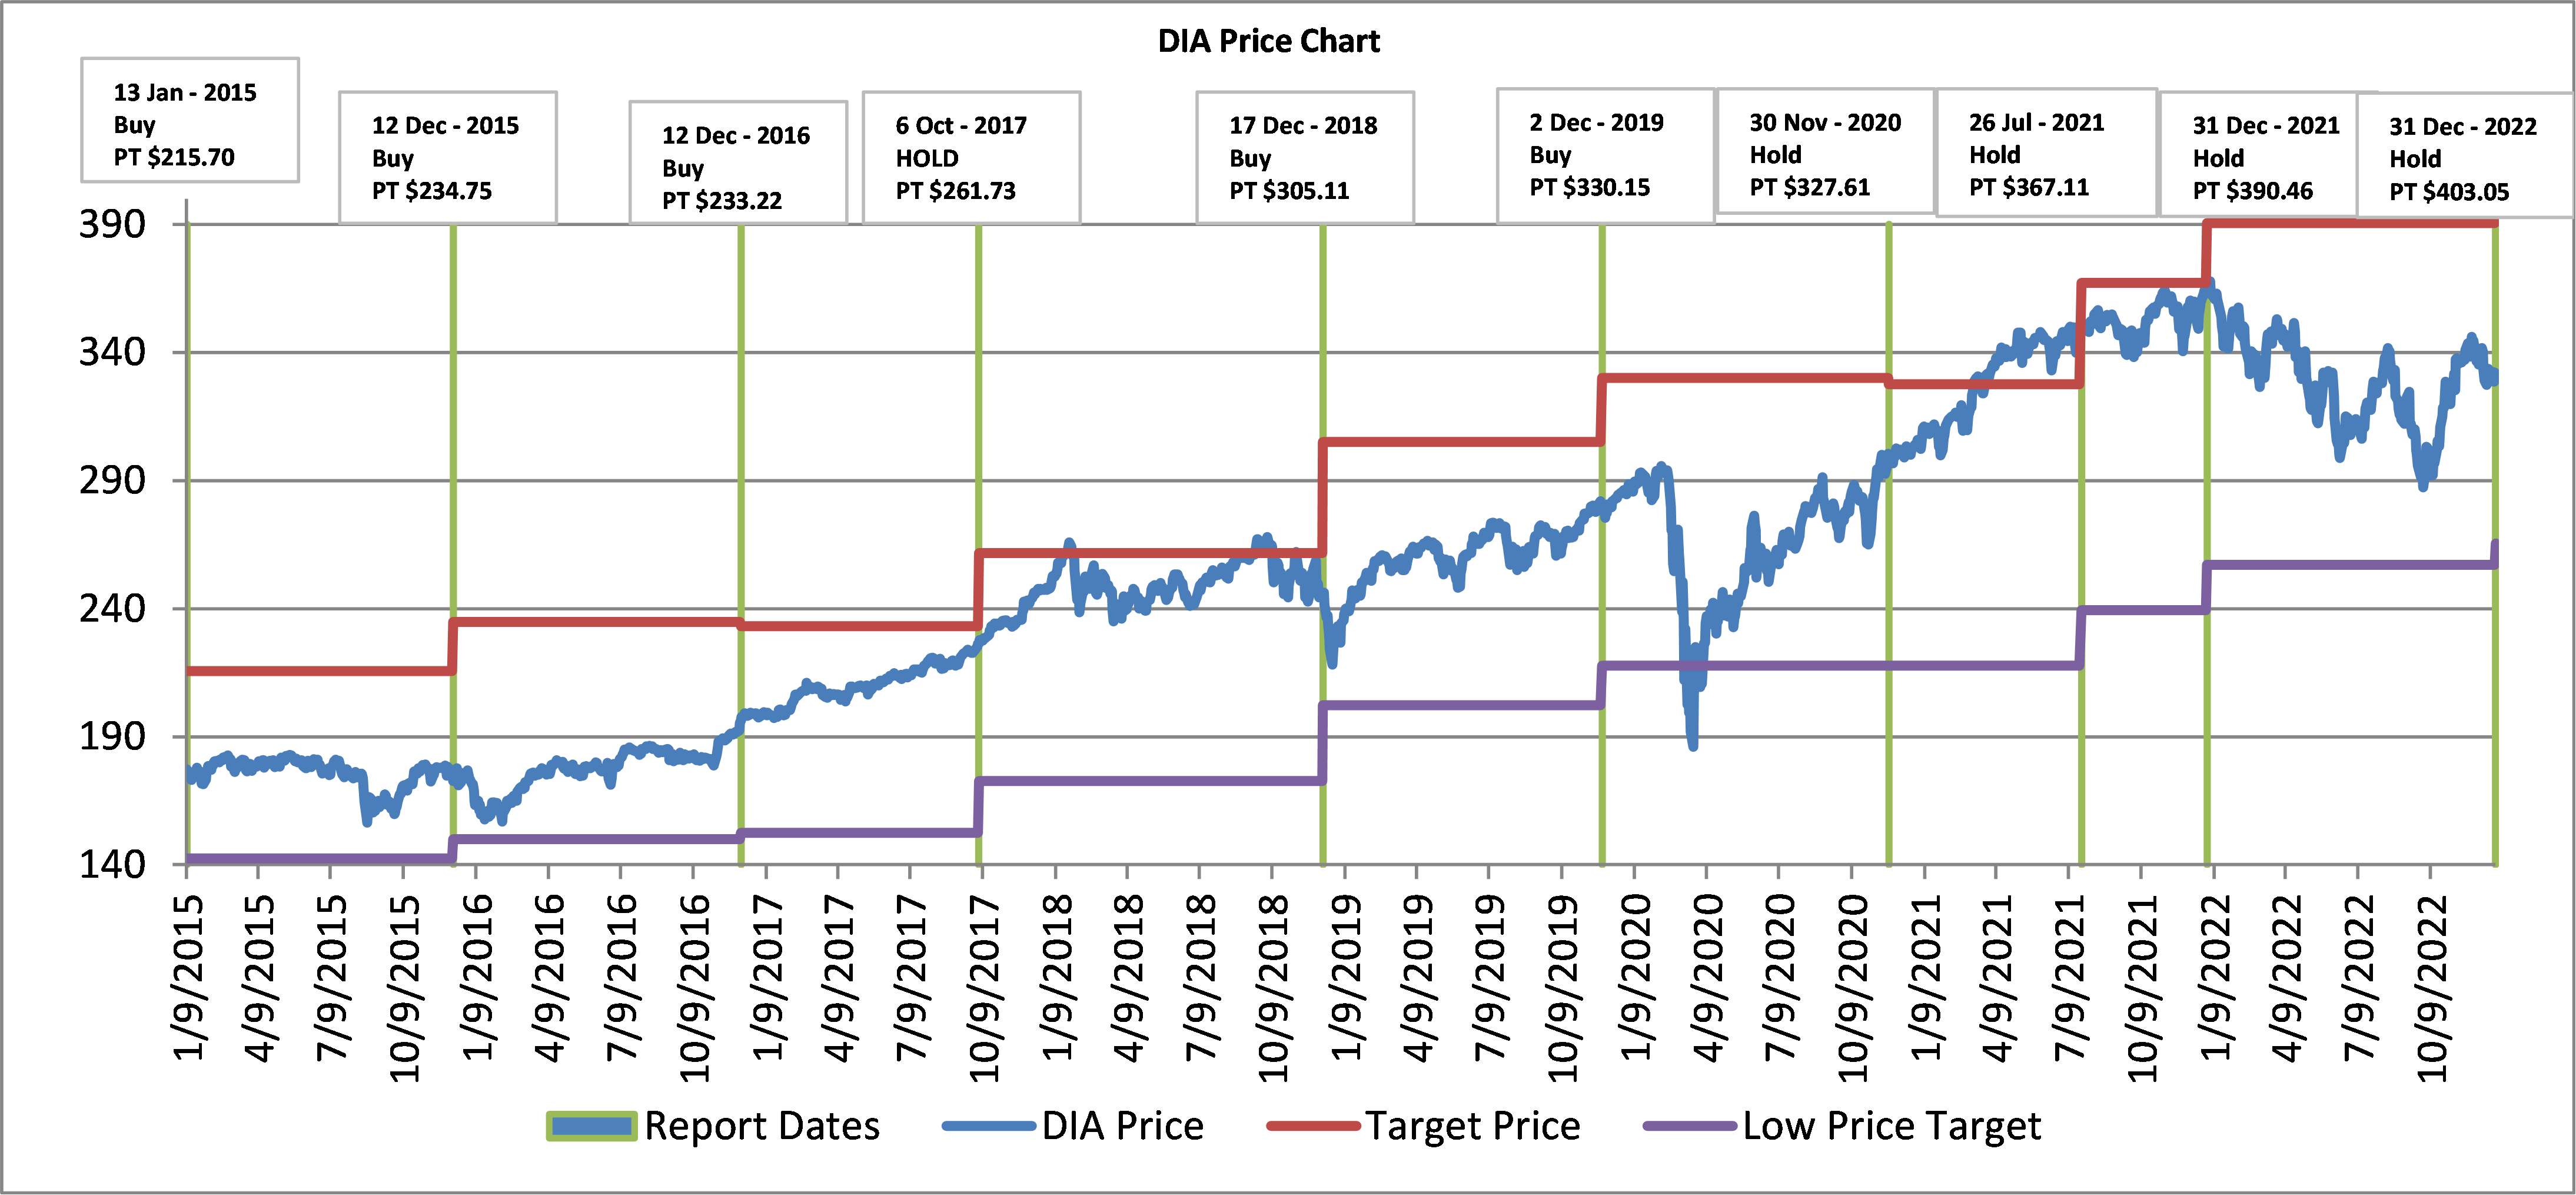
I will let the reader decide for himself, but I would point out that my analysis has correctly identified two technical points of resistance for the Dow Jones Industrial Index, one technical point of support for the stock Index, and has correctly identified the most undervalued asset classes consistently. I began this real time experiment 8 years ago and have posted all reports on Bloomberg. The following is a performance table since my 2021 report and my prior recommendations chart with both my high and low recommendations charted since 2015.
| Asset | 12/31/2021 | 12/31/2021 | Change |
| Gold (GLD etf) Bitcoin (BTC) Dow Jones Average ETF (DIA) iShares 7-10 Treasury ETF (IEF) 10-Year Treasury Bond Yield | $170.96 $46,208 $363.32 $115.00 1.512% | $169.64 $16,574 $331.33 $95.78 3.879% | -0.77% -64.1% -8.80% -15.84% 2.367% |
Performance does not include dividends or interest. Source: FinTrust, Tradestation, iShares.com
Source: Bloomberg and FinTrust
What Policy Now? – A Top Down Look
“The current low levels of dividend and earnings yields relative to interest rates suggest a fair degree of caution. For the 52 weeks ending December 30, 2022, Barron’s reports the 12-month trailing earnings for the Dow 30 components at $1,562.14 v. $1,602.94 for the prior year, paid dividends of $687.40, and an equity book value increase to $7,439 from $6,543. Based on an earnings retention rate of 56.0% and a return on average equity of 22.34%, the implied expected book value growth for the next year would be a solid 12.51%, which, when added to an initial 2.07% dividend yield would lead to an expected 14.59% total return under average conditions. While impressive and consistent with historical ranges, I point out that economic conditions appear to be below average due to poor energy policies and geopolitics.
In expanding this analysis to the broader S&P 500 index, using data for book value, return on equity, dividends, and earnings returns, one finds that the S&P 500 companies experienced an earnings recovery, with earnings rising to $192.26 from $158.75. Likewise, dividends rose on a year-over-year basis to $67.96 vs. the prior year’s $62.44. Meanwhile, average equity for the S&P 500 was $967 for the trailing 12 months, which, when combined with the 64.65% earnings retention rate, yields an expectation for book value growth of 12.84%. This 12.84% growth, when added to the initial 1.77% yield, leads to a total return expectation of 14.61% for the next twelve months.
Given that my interest is in determining portfolio policy for the defensive investor, I have previously suggested a few modifications to Mr. Graham’s methods. First, to stress-test the analysis, I have previously suggested deflating current profits by 1/3 for a normalization of interest rates. As previously mentioned, I had estimated the degree of interest rate distortion to be 1.75%-2.0%. In years past, I have also suggested adjusting the return expectations by the one-year probability of a down year in stocks (35.65% for the 115 years from 1901-2016) due to recessionary risk which seem to have become an almost permanent feature of markets due to bad economic policies.
What portfolio policy then for the “defensive” investor?
It must be evident to the reader that I continue to find the stocks of the Dow Jones Industrial Average at today’s prices look better on average than taxable bonds given the spread between the expected total return on equities (14.50% and 14.61% for the Dow and S&P) versus the (5.41%) yield on taxable bonds. I am more confident in the analysis now that interest rates have increased, but I remain concerned in my analysis until inflationary pressures decline to levels below nominal interest rates, which I believe will happen by the second quarter of 2023. Despite trading near the midpoint of my estimated range, the case for equities at today’s prices is still not so compelling when compared to high-quality bonds and alternatives as to lead a defensive investor to completely abandon balanced asset allocations in the search of a little more growth and income.
Portfolio Policy – A Bottom’s Up Look
In discussing common stock selection for the defensive investor, Graham suggests the following:
- Adequate though not excessive diversification, meaning a minimum of ten to a maximum of about 30 stocks.
- Limit selections to large prominent and conservatively financed corporations.
- Each company should have a long record of continuous dividends. (I would adjust to include non-dividend paying companies with long histories of increasing earning and/or share repurchases in lieu of dividends).
- An investor should place a limit on the price he will pay in relation to average earnings over say the past 7 years.
Later, in The Intelligent Investor, Graham figures that estimates for a group of equities are likely to be a good deal more dependable than those for individual companies, and he uses data from Value Line to illustrate his point. The outcome of this effort, in 1965, found that while earnings estimates proved to be high and many wrong, the use of low multipliers on earnings led to reasonable results for a portfolio of equities over the following five years.
In an effort to produce an analysis similar to Prof. Graham, I once again took the Dow 30 Components, a diverse set of 30 prominent and conservatively financed corporations. I then calculated the average ratios of price to sales, price to earnings, dividend yields, and price to book value for at least the previous 15 years (2007-2022), if available, in order to capture the period both before and after the global financial crisis and the Covid shutdown related recession. Then using both the annual high and annual low for the stock price, I calculated the corresponding price to sales, price to book, price to earnings and dividend yields and averaged these for each security across various trailing time periods. I further applied these average ratios to the forward estimates from Value Line, and MarketSmith and FinTrust estimates for each respective variable to develop price range estimates for each of Dow Components.
What portfolio policy then for the “defensive” investor?
As Mr. Graham cautions, the valuations reached by the method above are unlikely to prove sufficiently dependable, particularly on an individual company level, so an investor must endeavor to pay a low-prices in relation to average earnings.
Recommendation:
My analysis suggests levels below 33,427 on the Dow Jones Industrial Average would be below the 10-year average, and levels closer to 26,548 would represent low prices relative to the average results, while an index level of 40,305 would be considered rich in relation to past sales, earnings, book value, dividends, and forward analyst estimates. The data suggest that for the “defensive investor,” reasonable allocations toward common stocks at today’s levels appear appropriate and reasonable. Given the components of the Dow 30 collectively appear to trade at average levels (33,147 v. 33,427 or 99.16% of average), portfolio policy for the “defensive investor” should lean toward average equity allocations (so if one normally splits funds in a 50/50 ratio, the analysis suggests a 50/50 ratio). This represents an equity allocation increase of 5% versus last year’s analysis.
Risks to the Recommendation:
With the benefit of hindsight, Mr. Graham recognized in later editions that he underestimated the risks associated with bonds in 1965, as future inflation proved quite devastating to bond portfolios in the 1970s. No one, in 1965, anticipated the high inflation rate of the 1970s and the impact it was to have on both the earnings of corporations and bond portfolios. Interestingly, our prior data points looked similar to those of Mr. Graham’s 1965 edition, and 2022 seems to have brought a similar correction to both equity and bond prices. I still believe that the next large inflation could be digital in nature and that millennial investors may prefer uploading excess money to non-fiat currencies in the cloud with their phones verse the complications associated with investing in gold, real estate, and other fixed or tangible assets. In addition to unanticipated inflation, other risks to the recommendation include but are not limited to, regulatory, governmental, and tax law changes, political risks, the mere fact the future is uncertain, and all other risks normally associated with investments in common equities.
The table below contains the range estimates for the individual securities in the Dow Jones Industrial Index.
| Stock | Symbol | AveLowEst | AveHighEst | 12/31/2022 |
|---|---|---|---|---|
| Apple Inc. | AAPL | 80.27 | 136.19 | 129.93 |
| Amgen Inc. | AMGN | 218.57 | 308.28 | 262.64 |
| American Express | AXP | 111.98 | 157.94 | 190.49 |
| The Boeing Company | BA | 110.50 | 157.94 | 190.49 |
| Catepillar Inc. | CAT | 136.08 | 231.93 | 239.56 |
| Salesforce.com | CRM | 199.83 | 304.85 | 132.59 |
| Cisco Systems Inc. | CSCO | 39.95 | 55.74 | 47.64 |
| Chevron Corporation | CVX | 130.33 | 174.65 | 179.49 |
| The Walt Disney Company | DIS | 110.30 | 153.50 | 86.88 |
| Dow Inc. | DOW | 53.48 | 97.53 | 50.39 |
| The Goldman Sachs Group | GS | 358.11 | 640.76 | 343.38 |
| The Home Depot, Inc. | HD | 248.62 | 378.41 | 315.86 |
| Honeywell International Inc. | HON | 132.65 | 189.26 | 214.30 |
| International Business Machines | IBM | 134.38 | 194.51 | 140.89 |
| Intel Corporation | INTC | 40.54 | 57.87 | 26.43 |
| Johnson & Johnson | JNJ | 159.66 | 172.58 | 176.65 |
| JPMorgan Chase & Co. | JPM | 110.66 | 176.39 | 134.10 |
| The Coca-Cola Company | KO | 51.14 | 69.15 | 63.61 |
| McDonalds Corp. | MCD | 170.34 | 243.56 | 263.53 |
| 3M Company | MMM | 152.48 | 210.51 | 119.92 |
| Merk & Co. Inc. | MRK | 70.21 | 104.36 | 110.95 |
| Microsoft Corporation | MSFT | 174.11 | 256.63 | 239.82 |
| Nike Inc. | NKE | 82.89 | 118.14 | 117.01 |
| The Proctor & Gamble Company | PG | 108.44 | 141.60 | 151.56 |
| The Travelers Companies, Inc. | TRV | 141.09 | 205.11 | 187.49 |
| United Health Group Incorporated | UNH | 383.35 | 538.58 | 530.18 |
| Visa Inc. | V | 159.66 | 288.84 | 207.76 |
| Verizon Communications Inc. | VZ | 49.51 | 66.51 | 39.40 |
| Walgreens Boots Alliance Inc. | WBA | 52.14 | 78.39 | 37.36 |
| Wal-Mart Stores Inc. | WMT | 101.91 | 133.87 | 141.79 |
| Total | 4028.17 | 6115.48 | 5029.35 | |
| DowDivisor | 0.151727526 | 0.151727526 | 0.151727526 | |
| Index Est. | 26548.71 | 40305.67 | 33147.25 |
Source: Value Line, MarketSmith, and FinTrust estimates
Important Disclosures:
Analyst Certification: I hereby certify that the views expressed in this research report accurately reflect my personal views about the subject company(ies) and its(their) securities. I also certify that I have not, will not, nor are presently receiving direct and/or indirect compensation in exchange for any specific recommendation in this report. In addition, said analysts has not received compensation from any subject company in the last 12 months.
Ownership and Material Conflicts of Interest:
An analyst or a member of his household may not purchase the securities of a subject company 30 days before or 5 days after the issuance of the research analyst’s report or a change in ratings or price targets, trade inconsistent with the views expressed by the research analyst, and all transactions in the subject company (ies) securities for the research analyst’s personal trading account must be approved.
The research analyst nor a member of his household own any of the securities of the subject company including any options, rights, warrants, futures or long or short positions. Neither the research analyst nor a member of his household own 1% or more of any of the securities of the subject company based upon the same standards used to compute beneficial ownership for the purpose of reporting requirements under 13(d) of the Securities Act of 1934, as amended. However, at the time of this report, accounts managed by Mr. Gillespie, including but not limited to the FinTrust Income and Opportunity Fund, in which Mr. Gillespie is a shareholder, own shares in the companies referenced in this report. In addition, Mr. Gillespie owns bitcoin and various cryptocurrencies at the time of this report.
The research analyst or household member is not an officer, director, or advisory board member of the subject company.
The research analyst has not made a public appearance in front of more than 15 person to discuss the subject company and does not know or have reason to know at the time of this publication of any other material conflict of interest.
The firm does not believe these present any material conflict of interest involving the companies mentioned in this report.
Receipt of Compensation:
The firm does not engage in investment banking activities.
The subject company (ies) has not been a client in the past 12 months preceding the date of distribution of this research report and is not currently a client. The firm has not received non-investment banking compensation for products or services or other non-securities services from the subject company or any affiliated company.
The research analysts at the firm do not receive any compensation based on investment banking revenues and may be paid a bonus based upon the overall profitability of the firm.
Investment Banking Relationships:
The firm has not managed or co-managed a public offering or received investment banking compensation in the past 12 months regarding the subject company (ies).
The firm does not expect to receive or intend to seek investment banking compensation in the next 3 months from the subject company (ies).
Securities offered through Fintrust Brokerage Services, LLC (Member FINRA and SIPC) and Investment Advisory Services offered through Fintrust Capital Advisors, LLC. Any views expressed in this message are those of the individual sender, except where the message states otherwise and the sender is authorized to state them to be the views of any such entity. Trade instructions may not be accepted via email. This material does not constitute an offer to sell, solicitation of an offer to buy, recommendation to buy or representation as the suitability or appropriateness of any security, financial product or instrument, unless explicitly stated as such in the text of the email. Past performance is not necessarily indicative of future returns. Performance numbers have not necessarily been independently reviewed or audited and therefore we make no representation as to its accuracy. Any reference to the terms of any contracts should be treated as preliminary only and subject to our formal written confirmation.
This report is prepared for general circulation. This report is not produced based on any individual persons or entities investment objectives or financial situation and opinions expressed by the analyst are subject to change without notice. This report is not provided to any particular individual with a view toward their individual circumstances. Investors should consider this report as only a single factor in making an investment decision. Securities prices fluctuate and investors may receive back less than originally invested and are not guaranteed.
This information should not be construed as legal, regulatory, tax, or accounting advice. Any reference to the terms of any contracts should be treated as preliminary only and subject to our formal written confirmation This message (and any attached materials) is for the sole use of the intended recipient(s) and may contain information that is privileged, confidential and exempt from disclosure under applicable law. Any review, dissemination, distribution or duplication of this communication is strictly prohibited. If you are not the intended recipient, please contact the sender immediately by reply e-mail and destroy all copies of the original message.
No part of this document may be copied, photocopied, or duplicated in any form or other means redistributed or quote without the prior written consent of the firm. This report and its contents are the property of Fintrust Brokerage Services, LLC and are protected by applicable copyright, trade secret or other intellectual property laws. United States law, 17 U.S.C. Sec.501 et seq, provides for civil and criminal penalties for copyright infringement.
The firm does not make market in securities.
The firm does not buy or sell the subject company (ies) securities for its own account.
The firm does not buy or sell subject company (ies) securities on a principal basis with customers. The firm’s employees, or customers, may buy or sell the subject company (ies) securities.
Although the statements of fact in this report have been obtained from and are based upon outside sources that the firm believes to be reliable, the firm does not guarantee the accuracy or completeness of material contained in this report. Any such estimates or forecasts contained in this report may not be met. Past performance is not an indication of future results. Calculations of price targets are based on a combination of one or more methodologies generally accepted among financial analysts, including but not limited to, analysis of multiples and/or discounted cash flows (whether in whole or in part), or any other method which may be applied. Rating, target price and price history information on the subject company (ies) in this report is available upon request.
To receive any additional information upon which this report is based please contact (864) 288-2849, or write to:
Fintrust Brokerage Services, LLC
attn: Research Department
124 Verdae Blvd, Ste. 504
Greenville, SC 29607