While asset allocation is the process of diversifying a portfolio between asset classes, strategy diversification is the process of diversifying a portfolio within an asset class in order to minimize volatility or capitalize on opportunity. For example, dividend paying stocks may behave differently than high growth technology stocks and inflation linked bonds may behave differently than fixed rate bonds, while raw land and established income properties may behave differently within real estate.
Take a look at the chart below. We highlight 3 indexes in the Equity asset class; the S&P 500 Index, the MSCI USA High Dividend Yield Index, and the MSCI Emerging Markets Index. As you can see, there are 3 completely different Risk/Return and drawdown profiles within the Equity class. Investors that had exposure to all or some of these strategies would have had vastly different results in their portfolios, even if the overall asset allocation was the same.
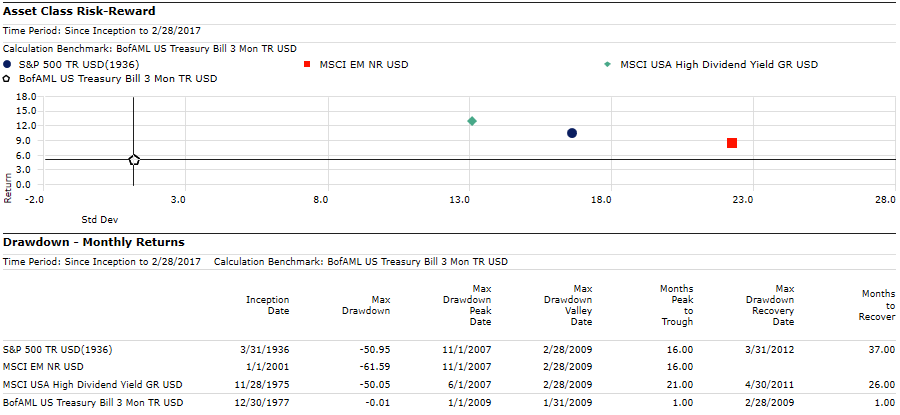
Source: Morningstar Direct. This chart illustration uses historical monthly performance for the listed indexes from their respective inception dates (listed above) through February 2017. Stocks are represented by the total returns including dividend reinvestment of the S&P 500, MSCI Emerging Markets, MSCI USA High Dividend Yield Index and the BofAML US Treasury Bill 3 month index. Chart is for illustrative purposes only and is not indicative of any investment. It is not possible to invest directly in an index. Past performance is no guarantee of future results.
The variation within the Fixed Income asset class is even more pronounced than in the equities example. Here we look at the BloombergBarclays US Treasury 1-3 Yr Index, the BloombergBarclays US Aggregate Bond Index, and the BloombergBarclays High Yield Corporate Bond Index.
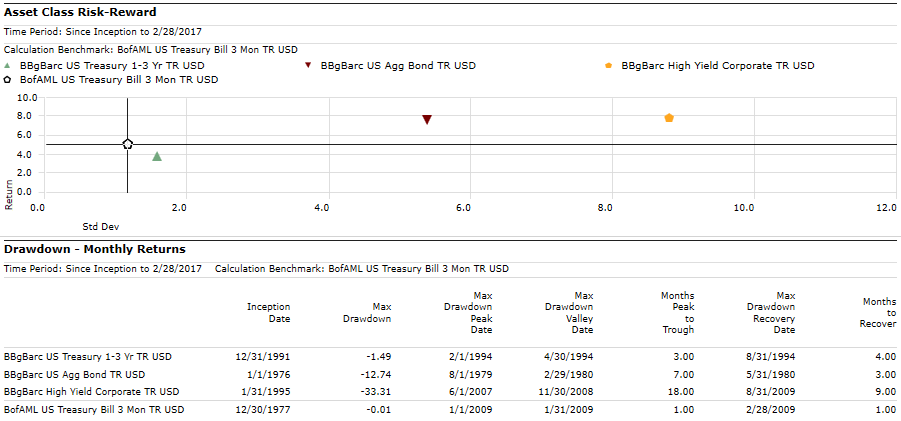
Source: Morningstar Direct. This chart illustration uses historical monthly performance for the listed indexes from their respective inception dates (listed above) through February 2017. Bonds are represented by the total returns including dividend reinvestment of the BloomberBarclays US Treasury 1- 3 Year, BloomberBarclays US Aggregate Bond Index, BloomberBarclays High Yield Corporate Index, and the BofAML US Treasury Bill 3 month index. Chart is for illustrative purposes only and is not indicative of any investment. It is not possible to invest directly in an index. Past performance is no guarantee of future results.
An investor who predominantly has high yield bond exposure would have a portfolio with a makeup similar to a stock portfolio from a Risk/Return profile, whereas an investor in short term treasuries took on much less risk, albeit at the expense of additional returns.
This simple example highlights the importance of strategy diversification, which in our view is one of the most overlooked and least talked about aspects of investment portfolio construction. The FinTrust process considers asset allocation first and foremost, but then looks for opportunities within asset classes by monitoring and researching a wide variety of asset class strategies to position our clients to succeed in a variety of market cycles.
This important step is one that many advisors and money managers overlook, and is another reason why clients can feel confident in FinTrust.