SUMMARY
- The Federal Reserve – Standing Tall Against Inflation
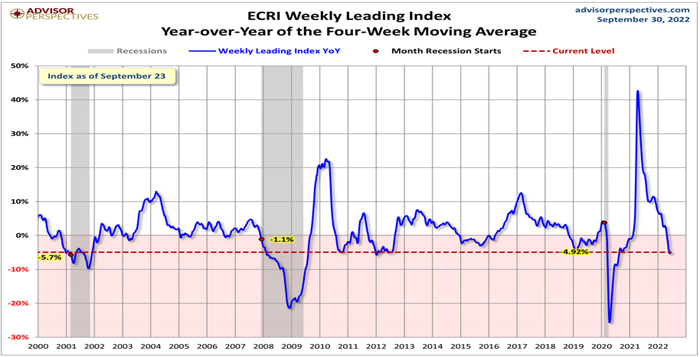
- Markets are worried Fed is hiking into an economic slowdown
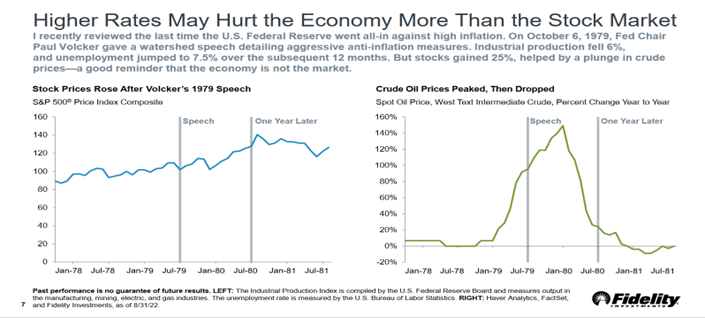
- Due to leads and lags, stock market performance and economic performance may differ
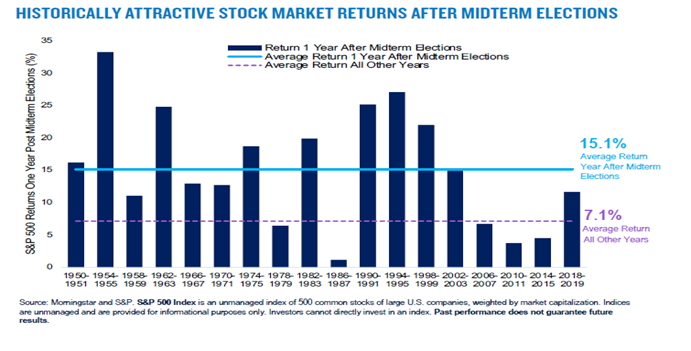
- Mid-term election uncertain typically depresses stocks prior to post mid-term year high
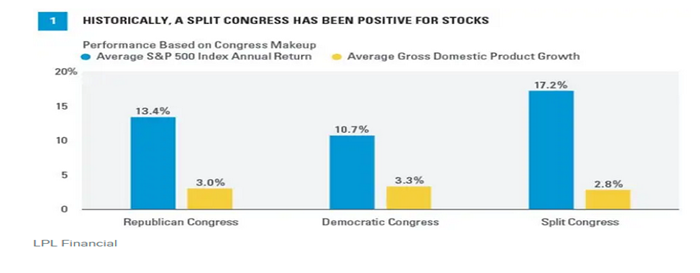
- Equity markets have performed best when there is a split Congress
Portfolio Commentary
Written by Allen Gillespie, CFA®, Chief Investment Officer
The Federal Reserve - Standing Tall
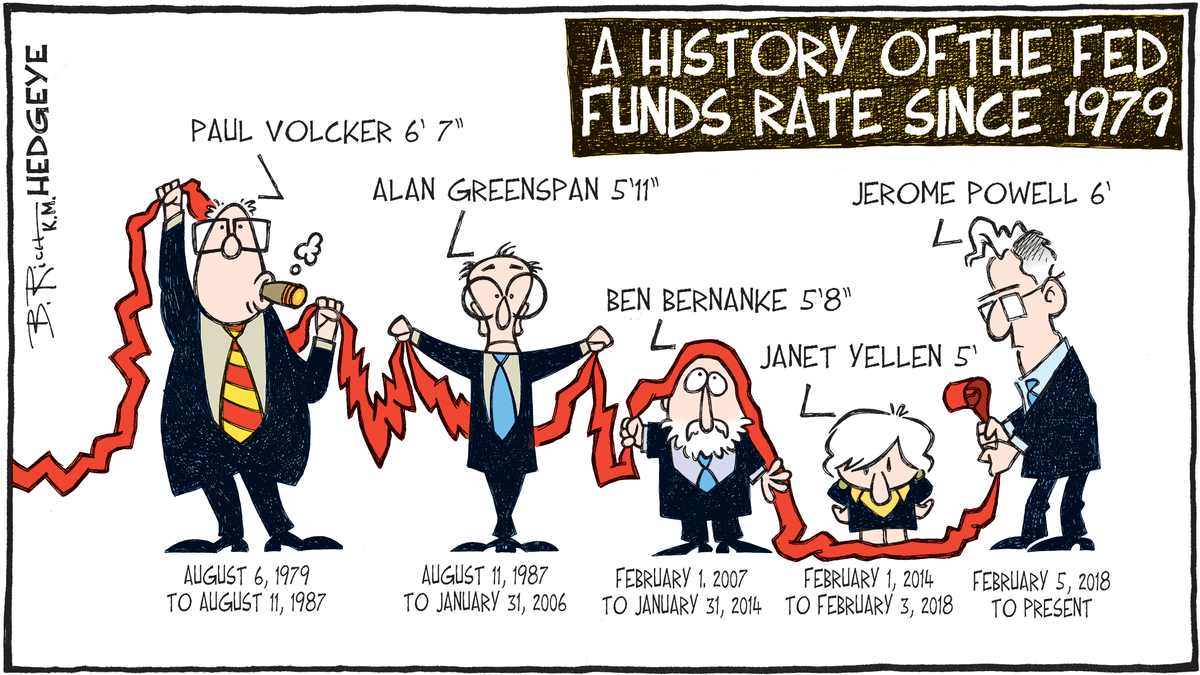
The cartoon above was initially published by Hedgeeye.com in 2017 as a fun commentary on what to expect with the appointment of Jerome Powell as Federal Reserve Chairman. Despite the forecasting accuracy of the cartoon, economists would consider the height of the Federal Reserve Chairman and interest rates a spurious correlation. In statistics, a spurious correlation refers to a connection between two variables that appears to be casual but is not.
Meanwhile, Sciencedirect.com, the National Library of Medicine, and a variety of medical journals, have a wide range of academic papers on the impacts of a person’s height on an individual’s personality and health. An example of one such paper is Stulp, Buunk, Verhulst, and Pollet’s article titled “Human Height Is Positively Related to Interpersonal Dominance in Dyadic Interactions.” They conclude that “human height is positively related to interpersonal dominance, and may well contribute to the widely observed positive association between height and social status.” Other studies suggest increased height is positively correlated to assertiveness and independence. We therefore should not be surprised that Jerome Powell’s Fed is being aggressive in its fight against inflation because he is both tall and would hate to lose social standing amongst his central banking peers.
Hiking into a Slowdown
The Stock Market and Economy
Mid-Term Election Political Uncertainty Depresses Equity Market Returns
Political uncertainty typically depresses equity market returns during mid-term election years. As a discounting mechanism, investors must price in economic policies, and mid-term election years typically lead to a recalibration of policy. According to PGIM, one of our bond fund managers, the stock markets have historically performed better on average after mid-term elections.
While voters want their “party” to win, LPL reports that the equity markets since 1950 have performed the best when there is split government. Business seems to prefer no change and compromise to bold policy initiatives.
Portfolio Outlook and Actions
Higher interest rates are positive for future fixed income asset class returns. In diversified portfolios, we believe there will opportunities to extend maturities and accept credit risk as inflation peaks and economic conditions weaken. Before making these changings, however, we are looking for confirmation that our inflationary view is correct. As the previous charts suggest, we are also constructive on equity markets for long-term investors, as companies ultimately have to pass through their increased costs. Historically, both higher inflation expectations and higher interest rates lead to higher equity market returns. This occurs because business must ultimately pass through their costs to customers, though it does take time. As year-end approaches, we therefore be looking for opportunities for tax loss harvesting and rebalancing.
Key Index Performance
| Index | QTD | YTD |
| S&P 500 (Large Capitalization Equity) | -5.28 | -24.77 |
| S&P 400 (Midcap Equity) | -2.88 | -22.47 |
| S&P 600 (Small Cap Equity | -5.59 | -24.02 |
| S&P 500 Growth Stocks | -3.86 | -30.41 |
| S&P 500 Value Stocks | -5.82 | -16.56 |
| S&P GSCI (Commodities) | 10.31 | 21.80 |
| S&P U.S. Aggregate Bond Index | -3.98 | -13.24 |
| Balanced Weighting (60/40) | -4.76 | -20.16 |
| S&P 500 Sectors | QTD | YTD |
| Energy | 1.65 | 33.94 |
| Utilities | -5.99 | -6.51 |
| Consumer Staples | -6.95 | -11.83 |
| Health Care | -5.18 | -13.08 |
| Industrials | -4.72 | -20.72 |
| Materials | -7.13 | -23.74 |
| Financials | -3.10 | -21.25 |
| Real Estate | -11.03 | -28.85 |
| Information Technology | -6.36 | -31.18 |
| Communication Services | -11.58 | -37.91 |
| Consumer Discretionary | 3.89 | -29.85 |
*Source: S&P Dow Jones Indices
Thank you for the trust you have placed in us, particularly during this difficult market environment. As always, if you have further questions, please do not hesitate to contact your FinTrust investment advisor.
Sincerely,
Your FinTrust Investment Team.
Important Disclaimer
Securities offered through FinTrust Brokerage Services, LLC (Member FINRA/ SIPC) and Investment Advisory Services offered through FinTrust Capital Advisors, LLC. Insurance services offered through FinTrust Capital Benefit Group, LLC. This material does not constitute an offer to sell, solicitation of an offer to buy, recommendation to buy or representation as the suitability or appropriateness of any security, financial product or instrument, unless explicitly stated as such. Past performance is not necessarily indicative of future returns. This information should not be construed as legal, regulatory, tax, or accounting advice. This material is provided for your general information. It does not take into account particular investment objectives, financial situations, or needs of individual clients. This material has been prepared based on information that FinTrust Capital Advisors believes to be reliable, but FinTrust makes no representation or warranty with respect to the accuracy or completeness of such information. Investors should carefully consider the investment objectives, risks, charges, and expenses for each fund or portfolio before investing. Views expressed are current only as of the date indicated, and are subject to change without notice. Forecasts may not be realized due to a variety of factors, including changes in economic growth, corporate profitability, geopolitical conditions, and inflation. The mention of a particular security is not intended to represent a stock-specific or other investment recommendation, and our view of these holdings may change at any time based on stock price movements, new research conclusions, or changes in risk preference. Index information is included to show the general trend in the securities markets during the periods indicated and is not intended to imply that any referenced portfolio is similar to the indexes in either composition or volatility. Index returns are not an exact representation of any particular investment, as you cannot invest directly in an index.