Random gleanings from the world of business, investments and economics
April Fed Meeting Edition
“Inflation is when you pay fifteen dollars for the ten-dollar haircut you used to get for five dollars when you had hair.” – Sam Ewing
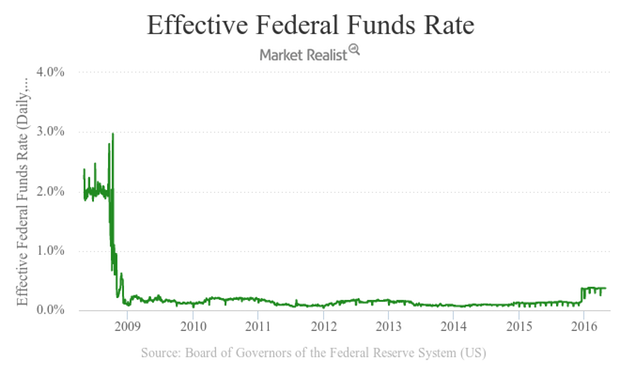
“Interest rates won’t go up until they do’”, announced the Federal Reserve Open Market Committee last Wednesday.
No. Those weren’t their exact words. Their exact words were “the federal funds rate is likely to remain, for some time, below levels that are expected to prevail in the longer run.”
For days economists worried about the phrase for some time. How long is “for some time”? Months? Years? The consensus interpretation is rates will go up, and maybe in September, or maybe not, but probably not before unless they do.
Comment: Glad to clear that up.
The 2% Solution
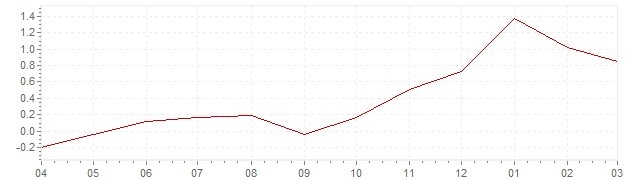
The average US inflation rate over the past year – source: Inflation.EU
The Fed was actually pretty clear last week. In trying to decide the future of interest rates, the Fed will focus on two key indicators: employment and inflation. 2% inflation is the magic number. If consumer prices begin to rise above 2%, and employment is strong, the Fed will probably raise rates slightly.
Check out the graph above, which shows inflation over the past 12 months. Even with that Mount Everest-looking spike at year-end, the line stays below 1.4%, well below 2%.
If 2% sounds scary, now look at the inflation graph below. For those of us over 50, this graph is a walk down memory lane, because inflation was a bid deal and effected our purchases, our investing and our planning. By 1979, inflation was running almost 15%.

U.S. Inflation over the past sixty years – Source Inflation.EU
Remember those spikes in ’73 and ’79? Just for fun, we priced a few consumer products in 1970, then repriced those items in 1979. Even after all that inflation, prices still sound cheap to us today.
Price increases from 1970 – 1979
- The average new car price rose from $2500 to $5012.
- A loaf of bread rose from 24 cents to 40 cents.
- One gallon of gas rose from 40 cents to $1.50.
- A postage stamp rose from 6 cents to 30 cents.
- The average salary was $8,933 in 1970. By 1979, the average salary was $10,991.
- In 1970 the average home mortgage interest rate was 5 percent and the average monthly payment was only $126.88. Ten years later interest rates averaged 12 percent and average monthly payments were $621.
Comment: Postage stamps rose 500% in the 70’s?!
Down with Stamps
If you haven’t mailed anything in the last couple of weeks, you may not realize that for the first time in 97 years, the price of a postage stamp just came down. On April 10 the price for a first class stamp dropped from 49 cents to 47 cents.
Congress pegs stamp prices to inflation. Because the US economy hasn’t experienced much inflation lately, the price of a stamp has dropped. Metered mail and postcards are cheaper too.
Sounds good to consumers, but for the US Postal Service this isn’t a feel-good story. They didn’t want cheaper stamps. “…reducing our prices in an irrational outcome considering the Postal Service’s precarious financial condition”, said Postmaster General Megan Brennan.
The price reduction will cost the USPS $2 billion a year.
Comment: Neither snow nor rain nor heat nor cheaper stamps…
Tax Perspective
This year’s tax season seemed to be more stressful than usual for CPA’s. If you ask an accountant about 2016, you’ll hear about the hassles of healthcare reporting, forms 1095 A & C, and system crashes at the IRS. The stress level was high.
In the middle of it all, theTax Foundation released a new statistic: In 2016, Americans will pay 20% more in total income tax than they will pay for the entire year’s housing, food, and clothing combined.
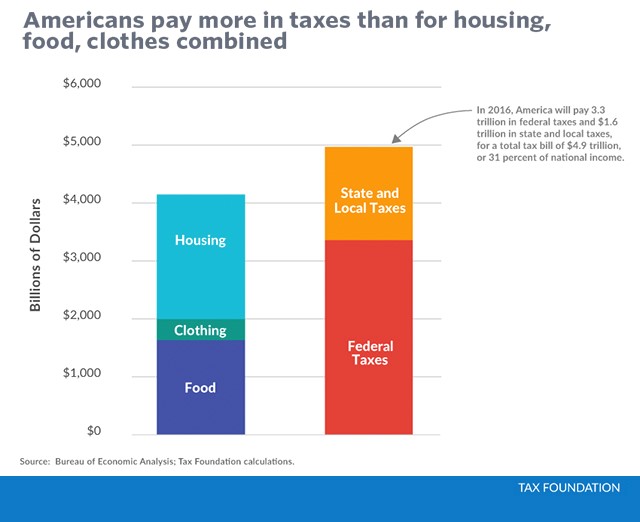
In 2016, Americans will spend $4.1 trillion on food, clothes and housing. Meanwhile, their total tax bill will be about $4.9 trillion ($3.34 trillion in federal taxes and $1.6 trillion state and local taxes).
Comment: Feels out of balance. But at least we will save money on postage stamps.
The Week Ahead
Economics
Monday, May 2: ISM Mfg Index, Construction Spending
Tuesday, May 3: Motor Vehicle Sales
Wednesday, May 4: International Trade
Thursday, May 5: Jobless Claims, Chain Store Sales
Friday, May 6: Employment Situation
Earnings
Monday, May 2: American International Group, FMC, Owens-Illinois, Sturm Ruger
Tuesday, May 3: Archer Daniels, Boise Cascade, CBS, Clorox, Cummins, CVS, Duke Energy, Freddie Mac, Halliburton, Pfizer
Wednesday, May 4: Anheuser-Busch, Centurylink, Fitbit, Humana, Kraft-Heinz, Royal Dutch Shell, Williams Cos
Thursday, May 5: Alibaba, Becton Dickinson, Church and Dwight, Fluor, Kellogg, Merck, Nintendo, News Corp, Time, YELP
Friday, May 6: Berkshire Hathaway
Watching the Tape is a compilation of news, observations and views written and edited by Bill Kibler, Senior VP, FinTrust Investment Advisors, bkibler@fintrustadvisors.com. Information is provided by sources believed to be reliable, but FinTrust is not responsible for accuracy. The information herein is not a recommendation to buy or sell any security. Past results are no indication of future performance.